Technical Analysis Oscillators and Indicators
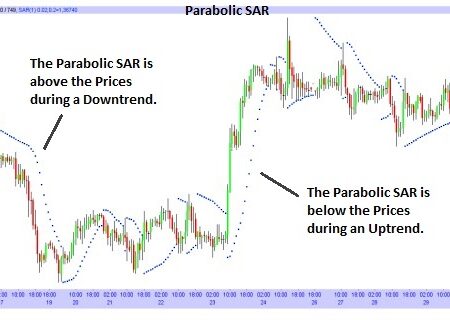
The Parabolic SAR (SAR means: Stop and Reverse), is a mathematical model that correlates the Time with the ...
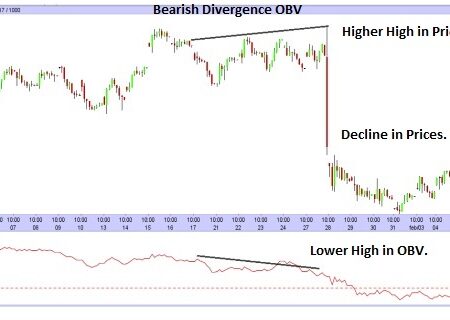
The On Balance Volume, also known as OBV, is a cumulative Indicator that is used to quantify the ...
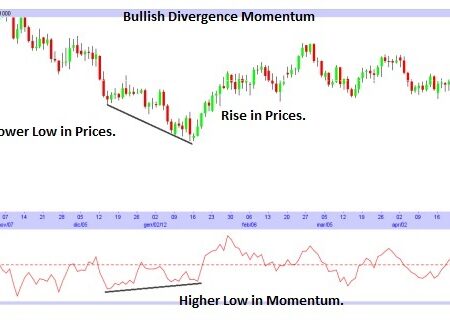
The Momentum Oscillator is one of the most important Oscillators, it is used to measure the rate of ...
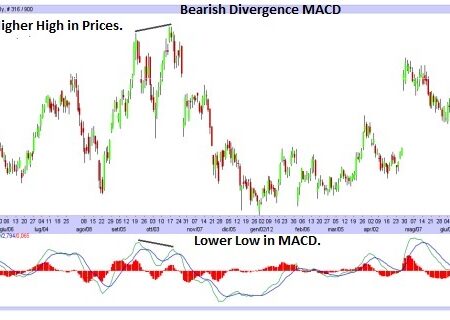
The MACD, known as Moving Average Convergence Divergence, is one of the most used Oscillator, and is also ...
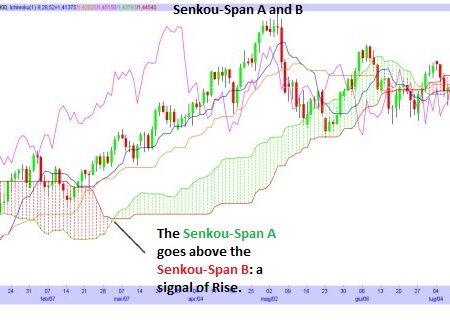
The Ichimoku Indicator (Also called Ichimoku Kinko Hyo) is a Technical Analysis Method that is built on the ...
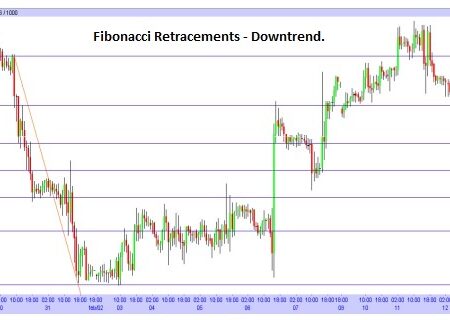
The Fibonacci Numbers are a particular sequence of numbers, that is very important and significant, composed by the ...
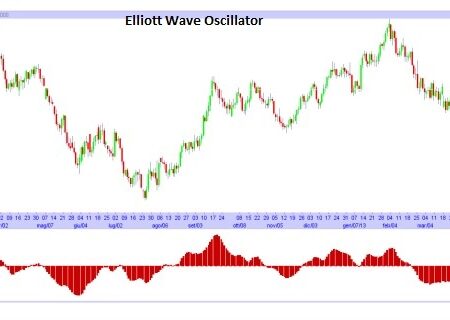
The Elliott Wave Oscillator has been created to help in the process of identification of the Elliott’s Waves ...
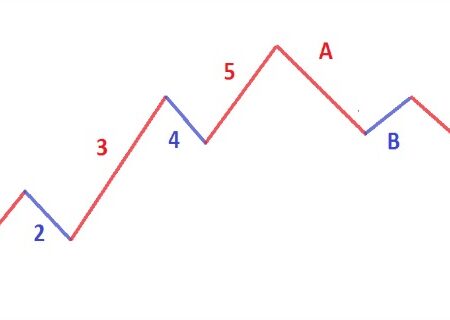
The Elliott theory aims to identify the recurrence of a particular Pattern (Waves) in the curves of the ...
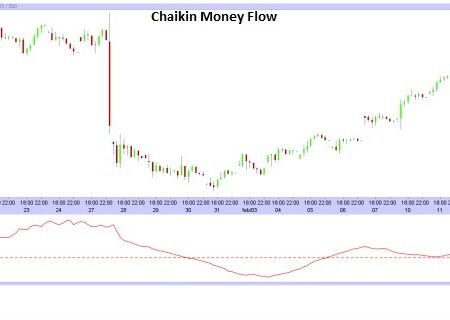
The Chaikin Money Flow, also known as CMF, is an Indicator that measures the amount of Money Flow ...
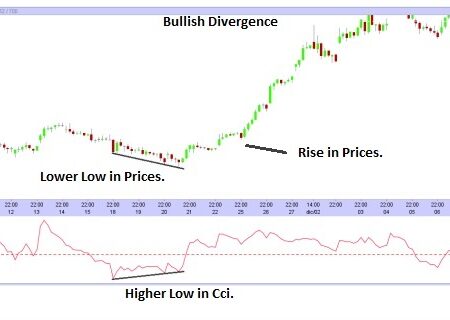
The Cci, also known as the Commodity Channel Index, measures the variations of the Prices from their statistical ...


![Binance Review: How the Crypto Exchange Works [2024]](https://www.feedroll.com/wp-content/uploads/2024/03/binance-trading-100x100.png)


