The On Balance Volume, also known as OBV, is a cumulative Indicator that is used to quantify the changes of Volume of a Period and it measures positive and negative volume flow. The OBV measures the buying and selling pressure for an Asset, adding volume on up days and subtracting volume on down days.
General Features of On Balance Volume
– The OBV line is usually applied in the Chart of the Prices, not below the Chart in another Chart.
– The OBV puts in comparison the Volume of the exchanges and the movements of the Prices.
How to Interpret the Signals from the OBV
– During a Sideways Trend: when the OBV is rising, it’s a signal of a possible Bullish Breakout, while when the OBV is falling, it’s a signal of a possible Bearish Breakout.
– During an Uptrend or Downtrend: a rise in the OBV confirms an Uptrend, while a decline in the OBV confirms a Downtrend.
– Other Signals: 1) If the OBV is falling but the Prices are rising, it’s a signal of weakness of the current Uptrend; 2) If the OBV is rising but the Prices are falling, it’s a signal of weakness of the current Downtrend.
– How to interpret the Divergences between OBV and Prices: Divergence means that on the Chart there is a certain movement, while the OBV does the opposite movement. There are two different types of Divergence.
There is the Bullish Divergence, signal of a possible Rise: there is a new Lower Low in the Prices while there is a new Higher Low in the OBV (So in the Prices there is a decline, while in the OBV there is a rise); that is a signal of a possible Rise in the Prices.
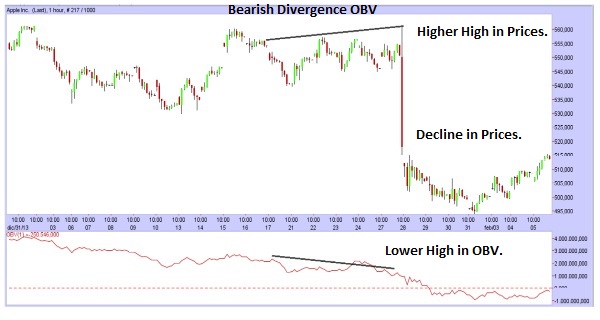
There is the Bearish Divergence, signal of a possible Decline: there is a new Higher High in the Prices while there is a new Lower High in the OBV (So in the Prices there is a rise, while in the OBV there is a decline); that is a signal of a possible Decline in the Prices.


![Binance Review: How the Crypto Exchange Works [2024]](https://www.feedroll.com/wp-content/uploads/2024/03/binance-trading-100x100.png)


