The Fibonacci Numbers are a particular sequence of numbers, that is very important and significant, composed by the sum of the two previous numbers; for example, a sequence of Fibonacci Numbers is the following: 1, 1, 2, 3, 5, 8, etc… . This sequence is used also to study the Charts, and four main “tools”,called the Fibonacci Tools, were created using this sequence:
1) Fibonacci Retracements; 2) Fibonacci Arcs; 3) Fibonacci Fans; 4) Fibonacci Time Extensions.
Let’s analyse now all the four tools of Fibonacci.
Fibonacci Retracements
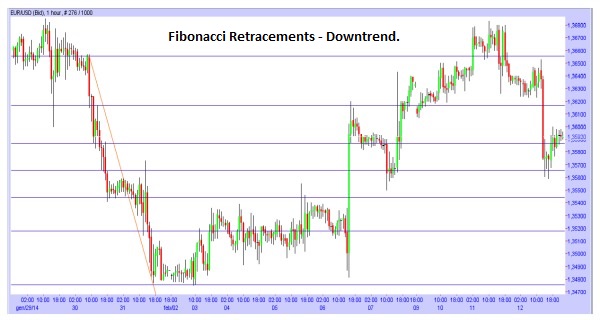
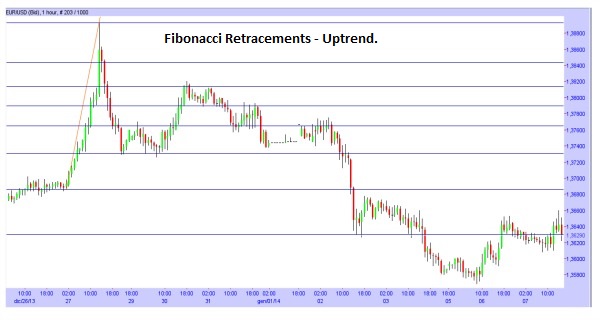
– They are the most used: to calculate them, you have to choose a Rise or a Decline in the Prices, then you have to find the High and Low of the Trend (That are the Beginning and ending or Ending and beginning of the Trend).
– After you’ve chosen the two points, the system (The trading platform on which you are working, if it has this option available) will plot some horizontal lines at the level of the “Ratio” of Fibonacci, that usually are: 0% and 100% (Beginning and ending of the Rise/Decline), then 23.6%, 38.2%, 50%, 62.8%, 76.4%. Then there are also other levels to be plotted, as: 161.8%, 261.8% and 423.6%; these levels are called extensions.
– These levels are used to identify the end of a correction, Trend or the beginning of a possible reversal; they are used as if they were Supports and Resistances.
– The levels of Fibonacci that coincide whit real Supports and Resistances, are more reliable.
– The levels of Fibonacci should be used with other Indicators or Patterns (From the Technical Analysis or the Candlestick Patterns).
Fibonacci Arcs
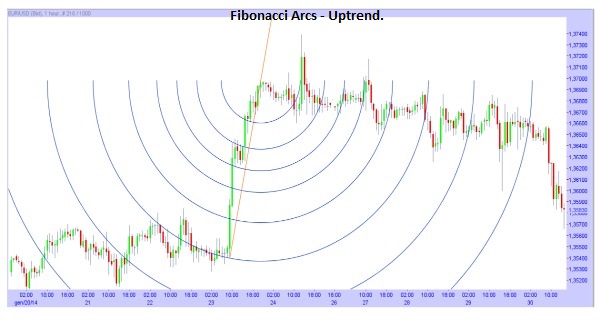
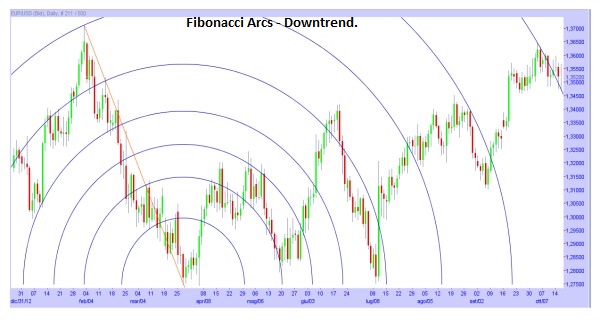
– They are used as the Fibonacci Retracements, to know the future levels of Support and Resistance and the Reversal of the Trend. If the Trend Line is rising, the arcs will be “directed” to the High; vice versa, if the Trend Line is falling, the arcs will be “directed” to the Low.
Fibonacci Fans
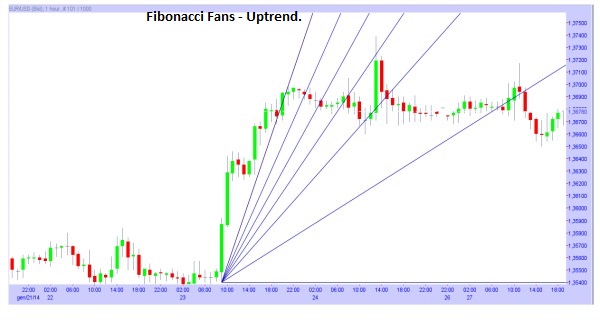
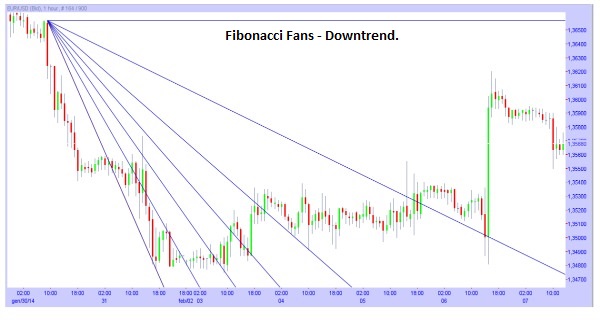
– They use the “Ratios” of Fibonacci, that are based on Time and Prices, to plot the Supports and Resistances; the Fibonacci Fans are used also to measure the speed of a movement of the Trend (Uptrend or Downtrend).
– If the Prices move below a Fan line (A decline), it’s expected that the Prices will still fall to reach or go near the Fan Line that is below the Previous Fan line (That it will work as a Support). If during a decline in the Prices between two Fan Lines, there is a rise, it’s expected that the Prices will still rise to reach or go near the Upper Fan Line (That it will work as a Resistance).
– So, if the prices are in a Downtrend, it’s expected that they will reach the lower Fan Line; if they are in an Uptrend, it’s expected that they will reach the Upper Fan Line.
Fibonacci Time Extensions
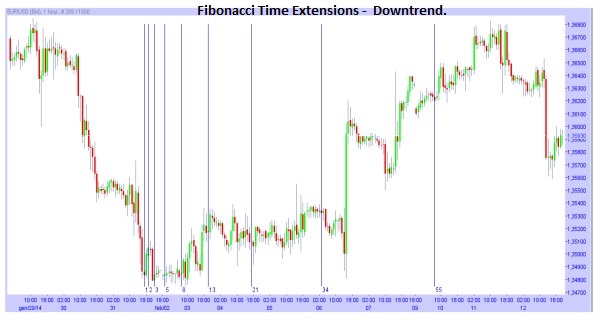
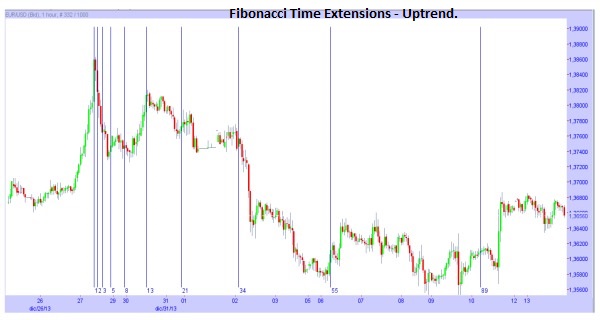
– They are vertical lines based on the sequence of Fibonacci and they are used to identify a possible reversal in the Trend. It’s used as the First Point for the Fibonacci Time Extensions an High or Low that is very important and meaningful.
– Normally the first five areas are not considered; so you should watch the following ares, to identify possible points of Reversal.
Conclusion on the Fibonacci Tools
– You should use other Indicators and Patterns (From the Technical Analysis or the Candlestick Patterns) to obtain a confirmation of the signals from the Fibonacci Tools.



![Binance Review: How the Crypto Exchange Works [2024]](https://www.feedroll.com/wp-content/uploads/2024/03/binance-trading-100x100.png)


