The Elliott theory aims to identify the recurrence of a particular Pattern (Waves) in the curves of the Prices of the past, so that you can recognize the Pattern in the present or future. According to this Theory, the financial markets move in cycles similar to Waves: firstly there is an Impulsive Wave then there is a Corrective Wave.
The Impulsive Wave, is divided into 5 sub-waves; the Corrective Wave, is divided into 3 sub-waves. Every market is composed by the succession of impulsive Waves and Corrective waves, creating a cycle of Eight movements (Or sub-waves). Let’s analyze the two waves, and then the full wave.
Impulsive Wave
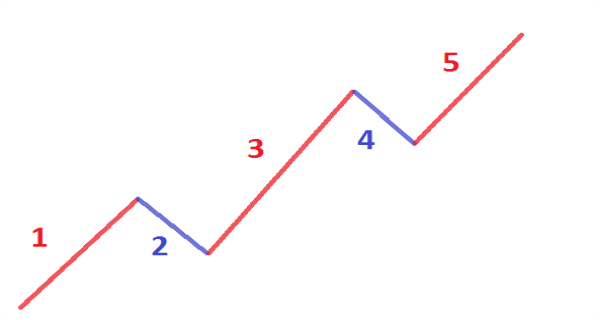
Impulsive wave phases explained:
1. Investors are approaching to the Asset with uncertainty, buying it.
2. After the rise, a part of the initial investors decide to sell their positions taking a profit.
3. After the short decline, the exchanges rise and also the prices.
4. A part of the investors takes a profit, selling, and so there is a decline.
5. The prices rise, thanks to the investors that keep buying driven by the euphoria of the positive Trend.
– The movements (Or sub-waves) 1, 3 and 5 are Impulsive because they represent a rise in prices as the current Trend (That is an Uptrend); The movements 2 and 4 are corrective, because they represent a decline in price while the current trend is an Uptrend.
-Then there is the Corrective Wave.
Corrective Wave
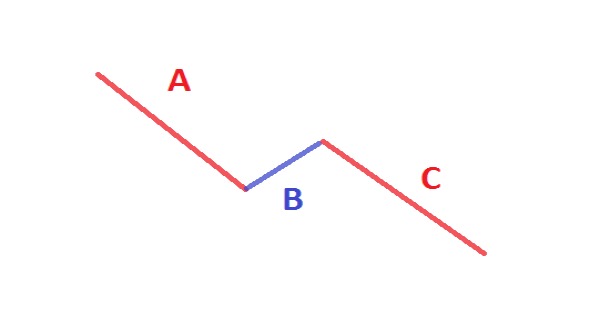
Corrective wave phases explained:
A. Prices are falling and a part of the investors sells.
B. There is a rise that deceives the investors.
C. The Downtrend continues, creating the “panic-selling,” where all the investors are selling as if there is no tomorrow.
– The movements A and C are impulsive because they represent a decline in prices as the current Trend (That is a Downtrend); The movement B is corrective, because it represents a rise in prices while the current trend is a Downtrend.
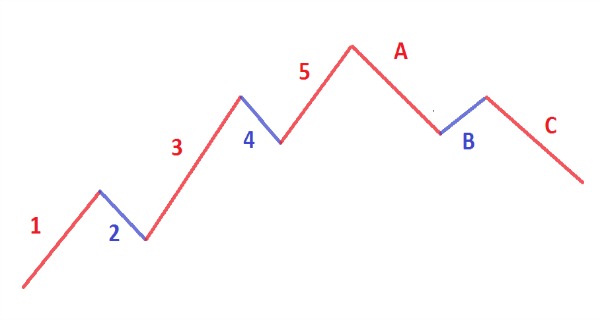
-Combining the Impulsive and Corrective Waves, you get the Full Wave, that represent a “cycle” of the Market.
Full Wave
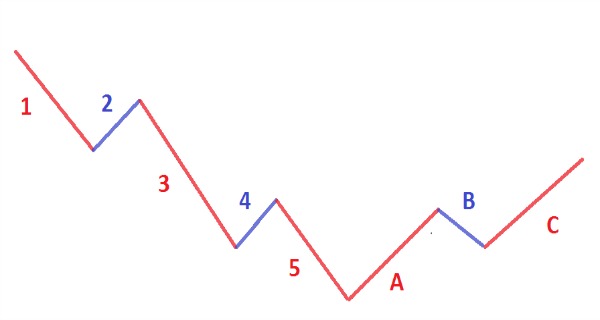
-But each Sub-wave, can be divided as an Impulsive Wave or a Corrective Wave, as shown in the next images.
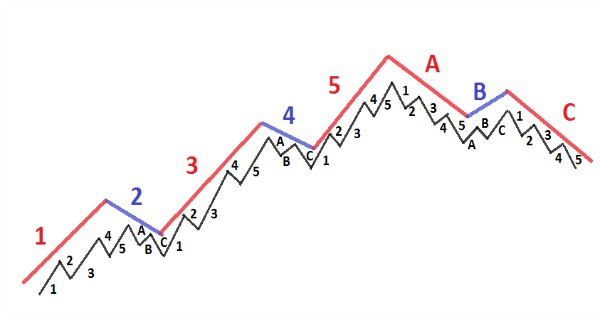
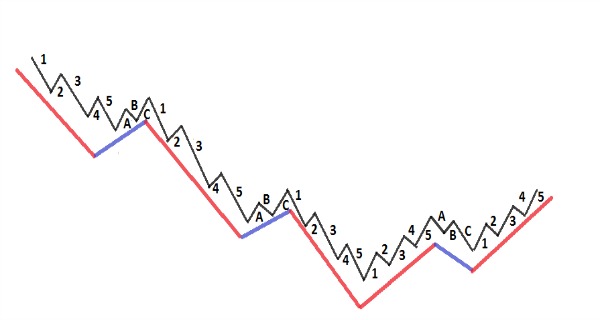
-As you can see, each movement (Or sub-wave) of the full Wave, contains one of the two types of Waves (Impulsive or Corrective).
The Three Rules
-There are only three rules to take into account when you have to interpret the Elliot wave; These three rules are essential and are applied only to the Impulsive Wave, that is composed by 5 sub-waves.
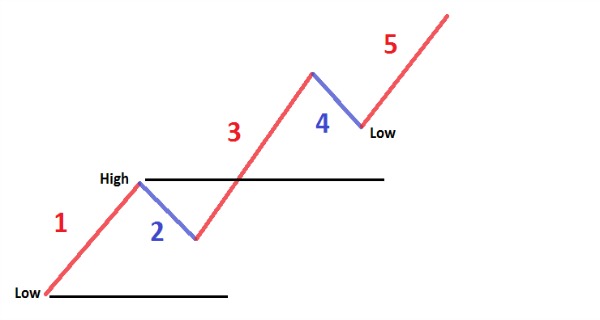
– 1 Rule: the sub-wave 2. cannot go lower than the 100% of sub-wave 1. .
– 2 Rule: the sub-wave 3. cannot be the shortest wave of the three Impulsive sub-Waves (sub-waves 1, 3 and 5).
– 3 Rule: the sub-wave 4. cannot overlap the sub-wave 1 . .
– The Low of the sub-wave 4. according to Rule 3, cannot go below the High of the sub-wave 1. .
– The sub-wave 2. according to Rule 1, cannot go below the Low of the sub-wave 1. .
The Three Guidelines
– These are the most important guidelines to know, that they can be used to search for confirmation of the Elliott Waves; it’s not necessary that all the guidelines are confirmed by the Chart, but it would be better if they are confirmed.
– Guideline 1: when the sub-wave 3. is the longest, the sub-wave 5. will be long more or less like the wave 1. .
– Guideline 2: the shape of the sub-wave 2. and 4. will alternate; If the sub-wave 2. is a sharp correction, sub-wave 4 will be a flat correction, whereas If the sub-wave 2. is a flat correction, the sub-wave 4 will be a sharp correction.
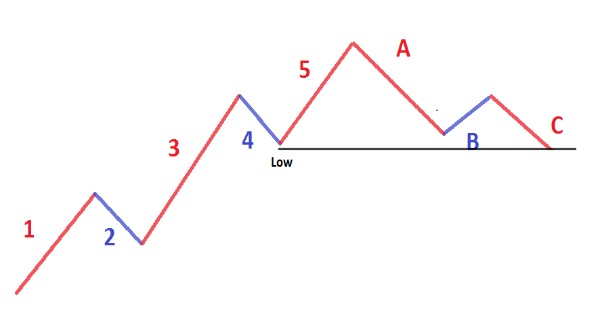
– Guideline 3: After the Impulsive Wave (composed of 5 movements), the Corrective Wave (composed of 3 movements), will finish in the area close to the Low of the sub-wave 4. .
– Considerations: the Guideline 1, is useful for predicting the end of the sub-wave 5. because even if the wave 5. can be longer than the 3. and the sub-wave 3. can be longer than the sub-wave 1. , you can make a prediction of the length of the sub-wave 5. , once that the sub-wave 4. is finished. Just apply the length of the sub-wave 1. to the Low of the sub-wave 4. , in order to obtain a Target of the end of the sub-wave 5. . The same method can be applied in case that the Impulsive Wave is in a Downtrend, just simply apply the length of the sub-wave 1. to the High of the sub-wave 4. to obtain a Target of the end of the sub-wave 5. .
– Other considerations: The guideline 2, is useful to identify the moment of correction of the sub-wave 4. . After the sharp decline of the sub-wave 2. , It is expected a flat correction for the sub-wave 4. (Or vice versa). The sharp correction is usually in decline for a large part of the length of the previous Wave (which is usually the 2.). While the “flat” (which is usually the 4.) comes after a long rise and so is shorter as corrective decline, because it is the “base” of the last and future rise of the sub-wave 5..
Conclusions
-To identify the complete Elliot Wave, you should use the Elliott Wave Oscillator explained in the following: Elliott Wave Oscillator.


![Binance Review: How the Crypto Exchange Works [2024]](https://www.feedroll.com/wp-content/uploads/2024/03/binance-trading-100x100.png)


