The Parabolic SAR (SAR means: Stop and Reverse), is a mathematical model that correlates the Time with the Prices. The objective of the Indicator is to find the points of a possible reversal of the Trend.
General Features of the Parabolic SAR
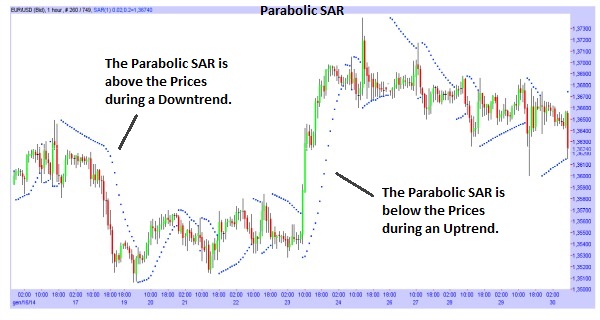
– The Parabolic SAR is above the Prices in a Downtrend; while is below the Prices in an Uptrend.
– The Parabolic SAR may seem similar to a Moving Average, but unlike the Moving Average, is the Indicator itself that moves above or below the Prices.
– When the curve of the SAR is reached by the Prices, the Trend is expected to reverse.
– The SAR should be use only during Uptrend or Downtrend, not during Sideways Trends.
– The SAR is also used to search for reliable level for the Stop Loss (To understand when a Trend is near its end or is already ended).
How to Interpret the Signals from the Parabolic SAR
– It is a signal of rise: when the Prices reach the Parabolic SAR, during a Downtrend.
– It is a signal of decline: when the Prices reach the Parabolic SAR during an Uptrend.
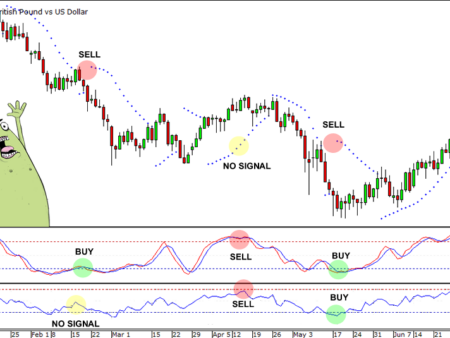
– When the Parabolic SAR goes from below the Prices to above, it’s a signal of decline in Prices.
– When the Parabolic SAR goes from above the Prices to below, it’s a signal of rise in Prices.


![Binance Review: How the Crypto Exchange Works [2024]](https://www.feedroll.com/wp-content/uploads/2024/03/binance-trading-100x100.png)


