The Momentum Oscillator is one of the most important Oscillators, it is used to measure the rate of change of an Asset’s price (It measures the change in the Closing Prices from a session to another one); if the prices are rising, the Momentum will rise whereas if the prices are falling, the Momentum will fall (The faster the prices rise or fall, the larger the increase or decrease will be in the Momentum). It is used to know the strength of a Trend or to find points of possible reversal of the Trend.
General Features of the Momentum Oscillator
– The Momentum can have positive or negative values, without limits.
– The only thing to take into account with the Momentum, is the Zero Line.
How to Interpret the Signals from the Momentum Oscillator
– High values of the Momentum (Positive or negative), mean that the Trend is very strong; whereas, low values of the Momentum (Positive or negative), mean that the Trend is very weak, so it’s the beginning of a Trend or the end of a Trend.
– Zero Line: if the Momentum goes above the Zero Line (So it goes from a negative value to a positive one), it’s a signal of rise in the Prices. Whereas, if the Momentum goes below the Zero Line (So it goes from a positive value to a negative one), it’s a signal of decline in the Prices.
– The Momentum tends to stay above the Zero Line during an Uptrend, while tend to stay below the Zero Line during a Downtrend.
– If the Values of the Momentum are higher than Zero: they show a phase of expansion and rise in Prices. 1) Increasing values of the Momentum, show a confirmation of the current Uptrend, that is very strong; 2) Decreasing values of the Momentum show that the current Uptrend is weakening: in this situation it could be a reversal.
– If the Values of the Momentum are lower than Zero: they show a phase of fall in Prices. 1) Decreasing values of the Momentum, show a confirmation of the current Downtrend, that is very strong; 2) Increasing values of the Momentum show that the current Downtrend is weakening: in this situation it could be a reversal.
– During a Sideways Trend: First you have to set the values for Overbought and Oversold (Usually the level chosen, should passed through 2/3 of the Previous Highs and Lows of the Sideways Trend).
1) When the Momentum goes below the level of Oversold and then goes back above this level, it’s a signal of rise in Prices. 2) When the Momentum goes above the level of Overbought and then goes back below this level, it’s a signal of decline in Prices.
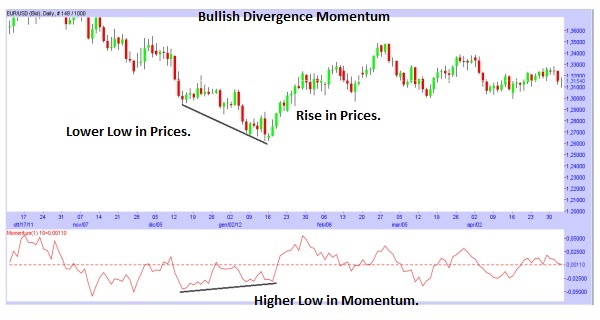
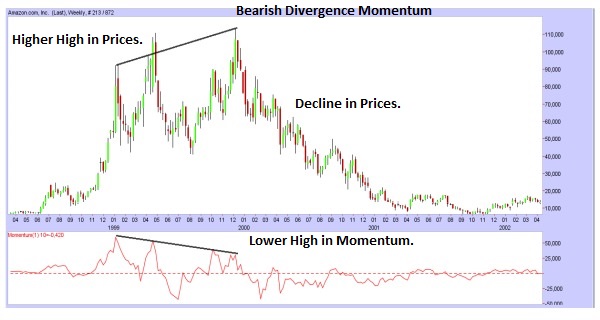
– Using the Divergences: Normally the Momentum follows the movements of the Prices, but when that does not occur, there is a Divergence. When there is a rise in Prices (New Higher High in Prices) while there is a decline in Momentum (New Lower High), it’s a signal of a possible decline in Prices. Whereas, when there is a decline in Prices (New Lower Low) while there is a rise in Momentum (New Higher Low), it’s a signal of a possible rise in Prices.


![Binance Review: How the Crypto Exchange Works [2024]](https://www.feedroll.com/wp-content/uploads/2024/03/binance-trading-100x100.png)


