Technical Analysis Oscillators and Indicators

The Bollinger Bands are one of the most used and famous Indicators; they are based on the volatility ...
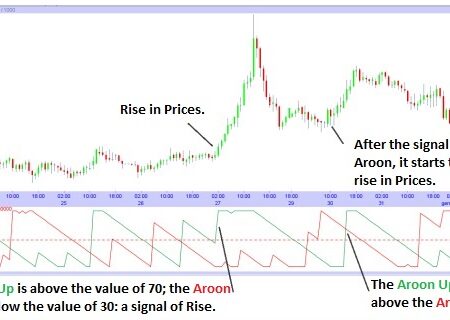
The Aroon Indicator is used to know when there is an Uptrend, Downtrend or Sideways Trend in the ...
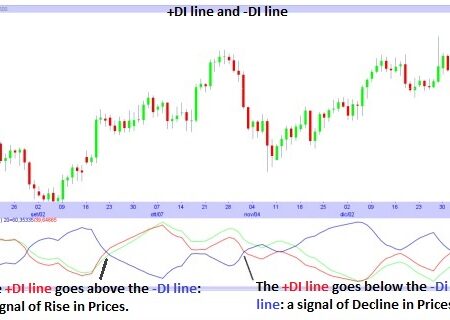
The Indicator ADX, also known as Average Directional Index, is based on the movements of the Prices and ...
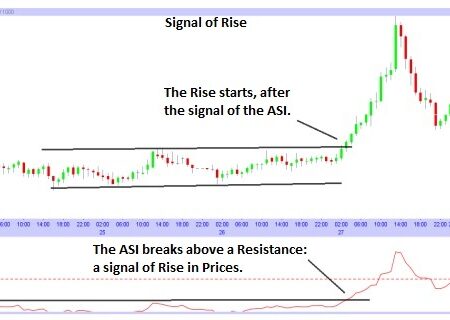
The Accumulative Swing Index, also known as ASI, is an Indicator used to analyse a current Trend or ...
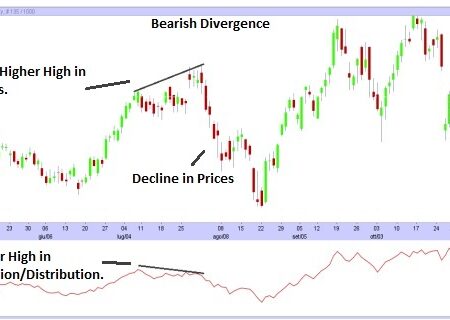
The Accumulation/Distribution Line is a volume-based Indicator that relates the Volume and the Prices. The purpose of this ...
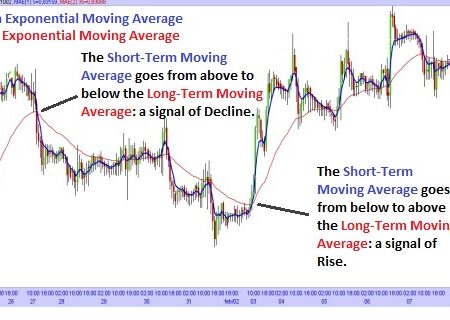
Using multiple Moving Averages: a method to use the Moving Averages, is to insert two moving averages on ...
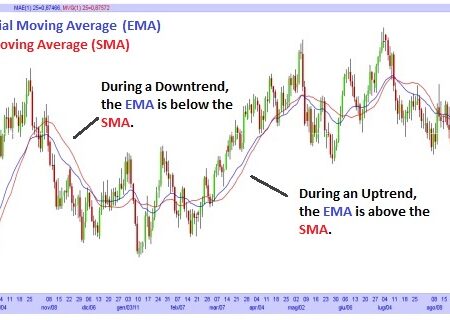
Let’s analyse these two following types of moving averages: Weighted Moving Average vs Exponential Moving Average (Also known ...
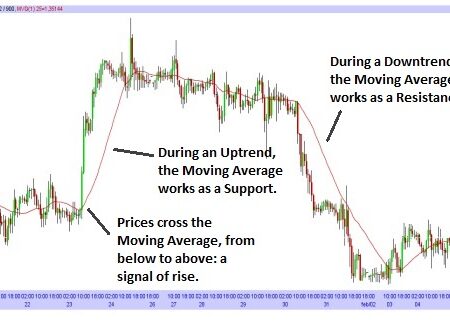
The simple moving average (also known as SMA) is certainly the most known and used oscillator, but also ...
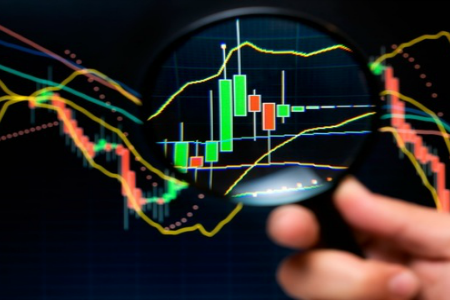
Oscillators and Indicators are “tools” of the Technical Analysis, used to study the movements of the Prices. There ...
The technical analysis (As we said in our previous article: What do you need to work with Binary Options) ...


![Binance Review: How the Crypto Exchange Works [2024]](https://www.feedroll.com/wp-content/uploads/2024/03/binance-trading-100x100.png)


