The Indicator ADX, also known as Average Directional Index, is based on the movements of the Prices and is a directional movement Indicator; it measures the strength of the Trend and is one of the most important and used Indicators. While the DMI, also known as Directional Movement Index, is composed by the -DI (Minus Directional Indicator) and the +DI (Plus Directional Indicator); it works as the Average Directional Index and it’s used to measure the strength of the Trend. These two Indicators, are used together on the same Chart that we want to analyse.
General Features of the Average Directional Index and the Directional Movement Index
– The ADX and DMI measure the strength of a Trend, not the current direction of the Trend.
– The value of the ADX can oscillate between 0 and 100.
– The value of the DMI can oscillate between 0 and 100.
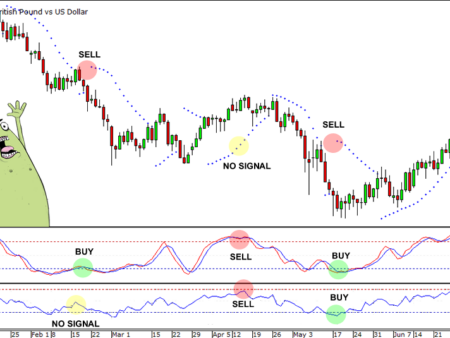
– The ADX (Green Line on the chart) can be considered as the “Moving Average” of the DMI.
– The DMI is composed by the +DI (Red line on the chart) and -DI (Blue line on the chart): the longer the distance between the two lines is, the stronger will be the current Trend.
How to interpret the Signals from the ADX and DMI
– How to recognize the strength of the Trend: when the value of the ADX is below 20, it means that the current Trend in the Prices is very weak (Or it means that there is not a “real” Trend); whereas if the value of the ADX is above 25, it means that there is a strong Trend in the Prices. In case that the value of the ADX is above 40, that would be a signal of a very strong Trend.
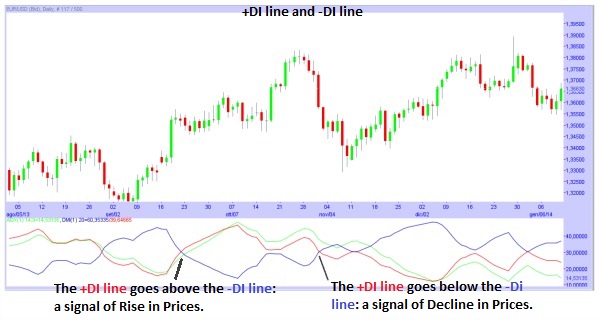
– When the +DI line is above the -DI line, it’s possible that there will be a rise in the Prices; whereas if the +DI line is below the -DI line, it’s possible that there will be a decline in the Prices.
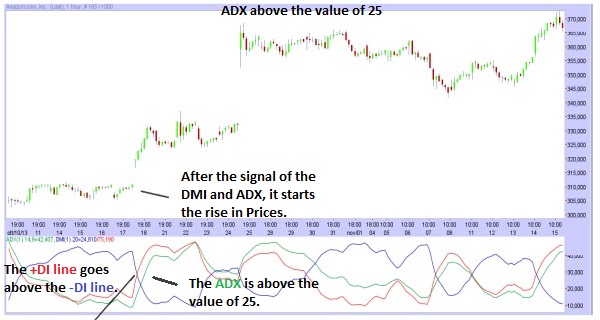
– If the ADX is above the value of 25, while the +DI line breaks above (Goes from below to above) the -DI line, it’s a signal of a possible rise in the Prices. Whereas if the ADX is above the value of 25, while the -DI breaks above (Goes from below to above) the +DI line, it’s a signal of a possible decline in the prices.
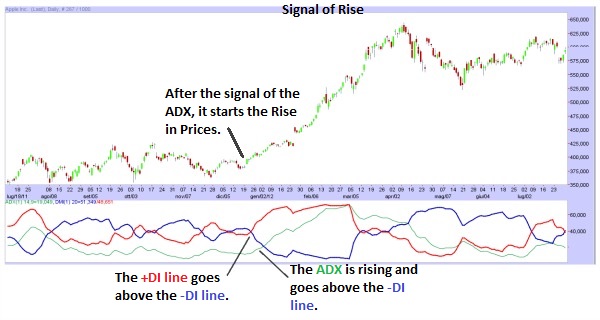
– When the +DI line is above the -DI line, while the ADX is rising and during this rise the ADX goes above the +DI line, it’s a signal of a possible rise in the Prices. Whereas when the +DI line is below the -DI line, while the ADX is falling and during this decline the ADX goes below the +DI line, it’s a signal of a possible decline in the Prices.
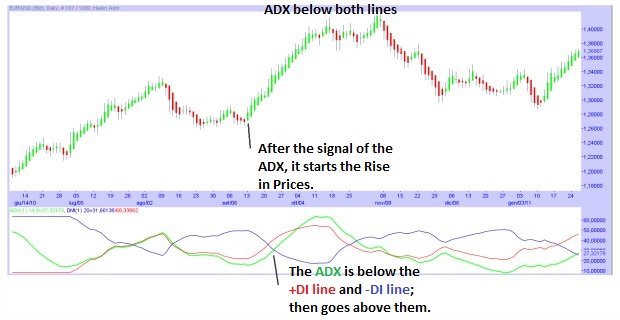
– When the ADX is below the +DI and -DI lines and the ADX goes above them, it’s a signal of a possible rise in the prices; whereas, when the ADX is above the +DI and -DI lines and the ADX goes below them, it’s a signal of a possible decline in the prices.


![Binance Review: How the Crypto Exchange Works [2024]](https://www.feedroll.com/wp-content/uploads/2024/03/binance-trading-100x100.png)


