The Accumulation/Distribution Line is a volume-based Indicator that relates the Volume and the Prices. The purpose of this Indicator is to better understand the intraday movements of the Prices; it will show us if there is a Phase of “Accumulation” (Period that is just before a phase of Rise in prices) or if there is a Phase of “Distribution” (Period that is just before a phase of Decline in prices).
Features of Accumulation/Distribution Line
– During the days of Accumulation, the Prices will be near their Highs while the A/D Indicator will increase.
– During the days of Distribution, the Prices will be near their Lows while the A/D Indicator will decrease.
– If there is an Uptrend in Prices while in the A/D there is a Downtrend, that’s a signal of a possible reversal in the Trend of the Prices (From Uptrend to Downtrend); whereas if there is a Downtrend in Prices while in the A/D there is an Uptrend, that is a signal of a possible reversal in the Trend of the Prices (From Downtrend to Uptrend).
– If the Prices are rising and the A/D is rising too, that is a signal of the strength of the current Uptrend in the Prices; while if the Prices are falling and the A/D is falling too, that is a signal of the strength of the current Downtrend in the Prices.
– A/D and On Balance Volume: they are both based on Volumes, but it happens that they move in two different direction at the same time, due to their different mathematical formulas on which they are created.
– How to interpret the Divergences between A/D and Prices: Divergence means that on the Chart there is a certain movement, while the A/D does the opposite movement. There are two different types of Divergence.
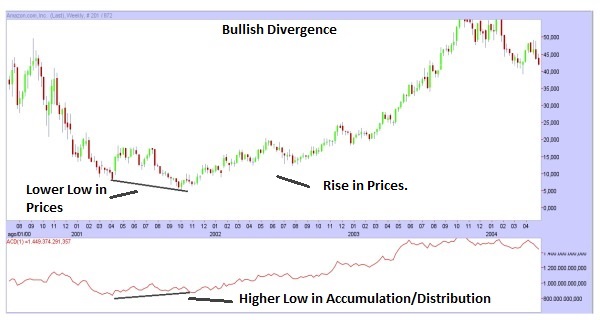
There is the Bullish Divergence, signal of a possible Rise: there is a new Lower Low in the Prices while there is a new Higher Low in the A/D (So in the Prices there is a decline, while in the A/D there is a rise); that is a signal of a possible Rise in the Prices.
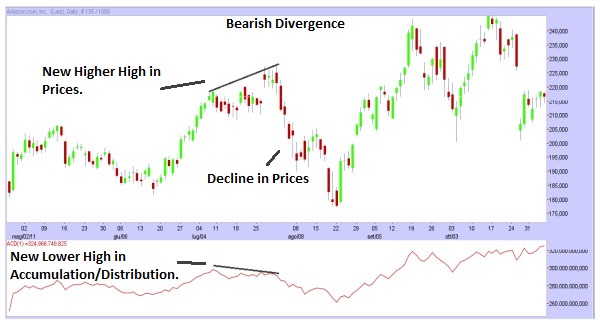
There is the Bearish Divergence, signal of a possible Decline: there is a new Higher High in the Prices while there is a new Lower High in the A/D (So in the Prices there is a rise, while in the A/D there is a decline); that is a signal of a possible Decline in the Prices.


![Binance Review: How the Crypto Exchange Works [2024]](https://www.feedroll.com/wp-content/uploads/2024/03/binance-trading-100x100.png)


