The simple moving average (also known as SMA) is certainly the most known and used oscillator, but also the easiest to understand of all the Technical Analysis. To calculate it, you have to take the values of the Price of a Period X (Period of time that you choose: it may be a period of 5 days or 10, 20, 25, 100, 200, etc. ..) and you have to do the average of these values. Of course, you do not need to do these calculations because all the Trading Platform have the option with which you can add a Moving Average to the Chart (Or you can add any other oscillators/indicators with a click).
Simple Moving Average
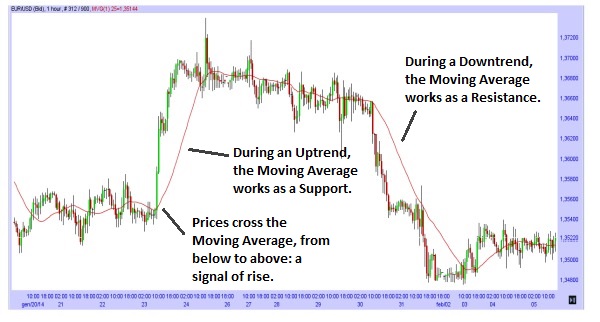
As you have seen from the previous image, the moving average follows the movements of the prices, although it does so with a bit of “delay”: the moving average helps to smooth the movements of the Prices and to filter out the “noise” (All the oscillations of the Prices that create false signals) . Moreover, you should remember that the longer the Period of the Moving Average is, the more will be delayed on the movements of the Prices; although the longer the Period of the Moving Average is, the more false signals will be avoided.
Furthermore, you may have noticed from the image, that the moving average during an Uptrend, will act as a support for the movements of the Prices; whereas during a Downtrend, will act as a resistance for the movements of the Prices.
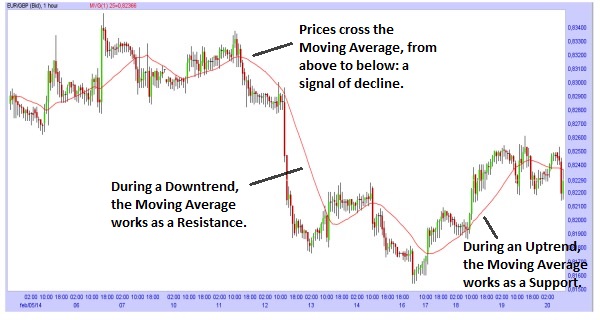
Lastly, you should pay attention when the Prices cross the Moving Average. If the Prices break below (Go from above to below) the Moving Average, it’s a signal of decline in Prices. Whereas if the Prices break above (Go from below to above) the Moving Average, it’s a signal of rise in Prices. The difficult part of using the Moving Average is this one: to recognize the point in which the Prices cross the Moving Average and if this point is important or not for the movement of the Prices. (For this reason, it is recommended to use other oscillator-indicators, Candlestick Patterns of Patterns from the Technical Analysis, to have a further confirmation of the signals obtained from the moving average).


![Binance Review: How the Crypto Exchange Works [2024]](https://www.feedroll.com/wp-content/uploads/2024/03/binance-trading-100x100.png)


