Oscillators and Indicators are “tools” of the Technical Analysis, used to study the movements of the Prices. There are a lot of Oscillators and Indicators, one different from the other, but all useful. They can be used during an Uptrend or Downtrend, but also during a Sideways Trend.
Moreover the Oscillators and Indicators, can help us to identify a phase during an Uptrend or Downtrend, where the strength of these movements is lower or higher than the normal. Furthermore with the Oscillators and Indicators, you can use also the Patterns from the Technical Analysis or the Candlestick Patterns, to confirm or not, the signals obtained from these Patterns. However, the Oscillators and Indicators should not be used alone, but should be used with the analysis of the Charts.
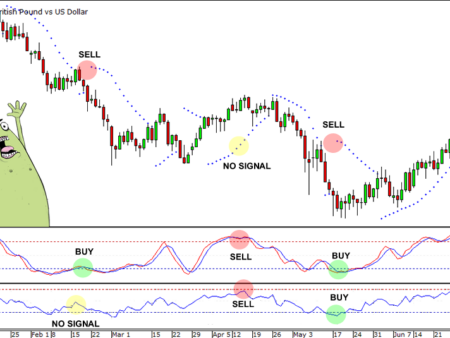
Normally the Oscillators and Indicators are located under the Charts of an Asset, in another particular chart for them; you can obtain signals from the comparison of the Oscillator or Indicator and the movements of the Prices, or only from the Oscillator or Indicator.


![Binance Review: How the Crypto Exchange Works [2024]](https://www.feedroll.com/wp-content/uploads/2024/03/binance-trading-100x100.png)


