The Bollinger Bands are one of the most used and famous Indicators; they are based on the volatility of the Prices. To calculate the Bollinger Bands, is usually used a Simple Moving Average with the Period of 20 days: to this Moving Average is added or subtracted the value of the Standard Deviation that is multiplied for a certain Factor. The Bollinger Bands are composed by three Parts: 1) An Upper Band; 2) A Lower Band; 3) A Simple Moving Average (that is in the middle of the two Bands).
General Features of the Bollinger Bands
– The Standard values to use are: for the Simple Moving Average the value is 20 days, while for the Standard Deviation is 2. If you want signals for the short-term you should use a Simple Moving Average with the value of 10 days and a Standard Deviation with a value of 1,9. Whereas if you want signals for the long-term you should use a Simple Moving Average with the value of 50 days and a Standard Deviation with the value of 2,1.
– However, as Bollinger himself said (Is the creator of the Bollinger Bands if you do not know), you should not change the standard value for the Moving Average; you should keep the same value for the Moving Average but you should change the Timeframe for the Chart (Normally the Timeframe is the Daily one). If you want to do Intraday Trading, you should use a Timeframe of 1h or 5-15 minutes; whereas, if you want to do long-term Trading, you should use a Timeframe of Weeks or Months.
– Lastly, as Bollinger himself said, you should use also other Indicators and not only the Bollinger Bands to verify the signals that you can obtain from the Bands. If two or more Indicators, confirm a signal obtained from the Bollinger Bands, this signal becomes more reliable.
How to Interpret the Signals from the Bollinger Bands
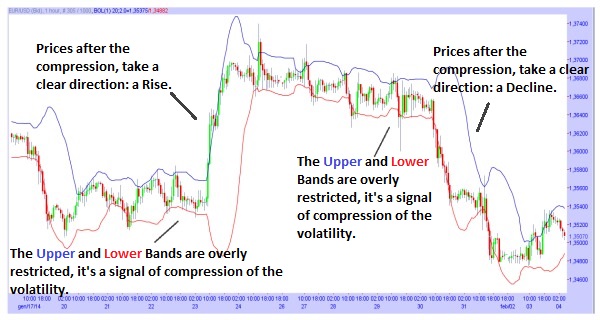
– When the Upper and Lower Bands are overly restricted, it’s a signal of compression of the volatility; the Prices are going to take a direction (Rise or Decline).
– The larger the space between the two Bands is, the higher is the volatility.
– When the Prices are rising and go near or break above (Goes from below to above) the Upper Band, for then go back below the Upper Band, it’s a signal of a possible decline in the Prices.
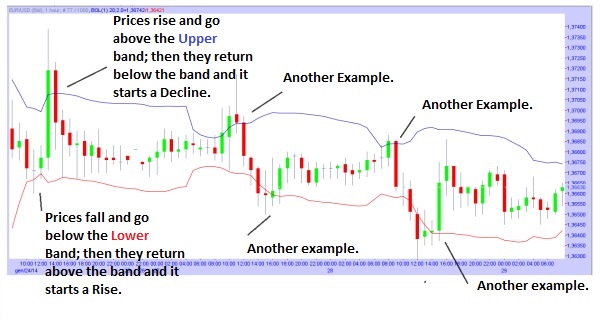
– When the Prices are falling and go near or near below (Goes from above to below) the Lower Band, for then go back above the Lower Band, it’s a signal of a possible rise in the Prices.
– The more the Prices go near or above the Upper Band, the more the Prices are in Overbought (It is a signal of a possible decline in the prices); whereas the more the Prices go near or below the Lower Band, the more the Prices are in Oversold (It is a signal of a possible rise in the Prices).


![Binance Review: How the Crypto Exchange Works [2024]](https://www.feedroll.com/wp-content/uploads/2024/03/binance-trading-100x100.png)


