The Accumulative Swing Index, also known as ASI, is an Indicator used to analyse a current Trend or to find a possible reversal in a Trend, but also to search for possible Divergences between Prices and ASI.
How to interpret the Signals of the Accumulative Swing Index
– We suggest you to use the ASI with Supports and Resistances, to obtain more signals from this Indicator.
– If the Prices are falling and the ASI is falling too, that is a confirmation of the current Downtrend in the Prices.
– If the Prices are rising and the ASI is rising too, that is a confirmation of the current Uptrend in the Prices.
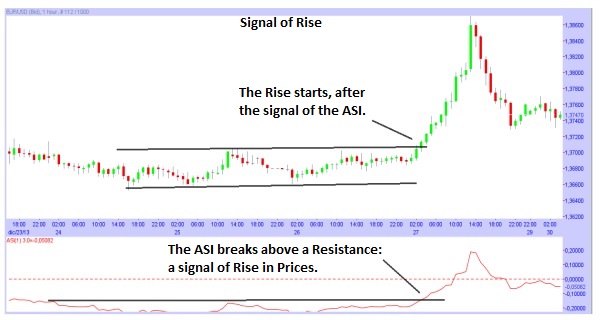
– Signal of Rise: when the ASI breaks above (Goes from below to above) a Trend Line or a Resistance (During a Downtrend or a Sideways Trend; in case is during an Uptrend, that is a confirmation of the strength of the Uptrend).
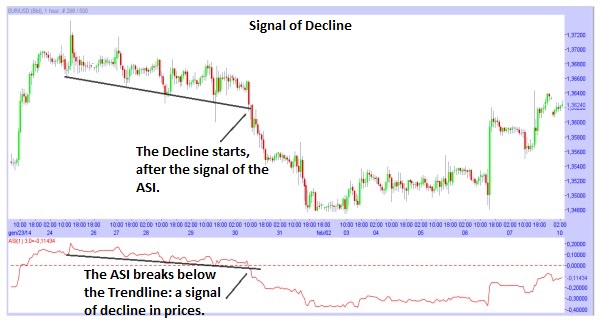
– Signal of Fall: when the ASI breaks below (Goes from above to below) a Trend Line or a Support (During an Uptrend or a Sideways Trend; in case is during a Downtrend, that is a confirmation of the strength of the Downtrend).


![Binance Review: How the Crypto Exchange Works [2024]](https://www.feedroll.com/wp-content/uploads/2024/03/binance-trading-100x100.png)


