The MACD, known as Moving Average Convergence Divergence, is one of the most used Oscillator, and is also one of the easiest to interpret and understand. The MACD use the different Moving Average together, to create signals for the movements of the Prices.
General Features
– To create the MACD, you need Three Exponential Moving Average (Called EMA) with these Periods (The standard ones): 1) EMA of 12 days; 2) EMA of 26 days; 3) EMA of 9 days, also called Signal Line.
– Choosing lower values for the First and Second EMA, you will obtain signals that are more responsive (But you will have more false signals); while, choosing higher values for the First and Second EMA, you will obtain less signals, but you will eliminate more false signals.
– The MACD oscillates around the Zero Line.
How to Interpret the Signals from the MACD
– Zero Line: when the MACD goes above the Zero Line, it’s a signal of rise in Prices; whereas if the MACD goes below the Zero Line, it’s a signal of decline in Prices (The Zero Line works as a Support or Resistance).
– Signal Line: when the MACD (Green Line) goes above the Signal Line (Blue Line; EMA of 9 days), it’s a signal of rise in Prices; whereas when the MACD goes below the Signal Line (EMA of 9 days), it’s a signal of decline in Prices.
– How to interpret the Divergences between MACD and Prices: Divergence means that on the Chart there is a certain movement, while the MACD does the opposite movement. There are two different types of Divergence.
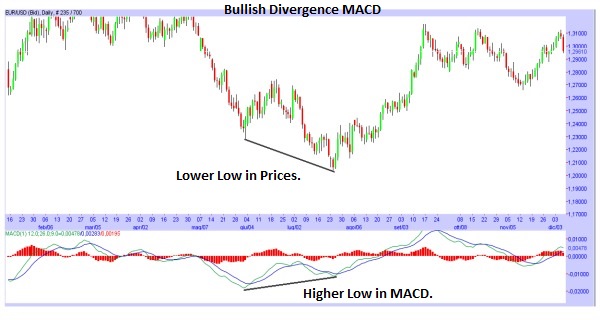
There is the Bullish Divergence, signal of a possible Rise: there is a new Lower Low in the Prices while there is a new Higher Low in the MACD (So in the Prices there is a decline, while in the MACD there is a rise); that is a signal of a possible Rise in the Prices.
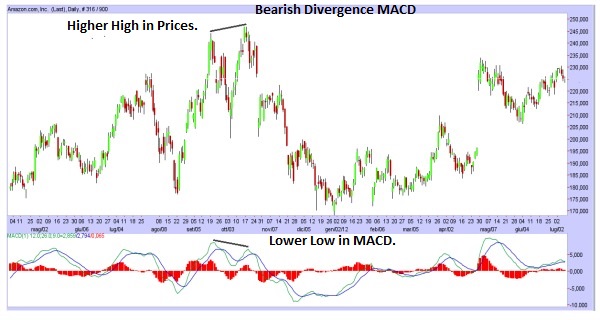
There is the Bearish Divergence, signal of a possible Decline: there is a new Higher High in the Prices while there is a new Lower High in the MACD (So in the Prices there is a rise, while in the MACD there is a decline); that is a signal of a possible Decline in the Prices.
– Other Signals: when the MACD is rising faster than the normal, it’s a signal of a possible phase of Overbought, that will lead to a decline to return to a normal situation. Whereas, when the MACD is falling faster than the normal, it’s a signal of a possible phase of Oversold, that will lead to a rise to return to a normal situation.


![Binance Review: How the Crypto Exchange Works [2024]](https://www.feedroll.com/wp-content/uploads/2024/03/binance-trading-100x100.png)


