The Cci, also known as the Commodity Channel Index, measures the variations of the Prices from their statistical average; it’s used to know when the Prices are in a situation of Overbought or Oversold.
General Features of the Commodity Channel Index
– The Cci can oscillate between the value of +100 and -100.
– It is used to determine the “Cycles” of the Trends; it works better with a Market with a strong Trend than one with a Sideways Trend.
– The standard Period is set at 20 days; using a lower value than 20 days, can create more false signals.
– Despite the name, the Cci can be used on every Asset (Stocks, Forex, Commodity, Index, etc… ).
How to Interpret the Signals from the Cci
– If the Cci is above the value of +100, it means that the Prices are very high and it’s a signal of a possible decline (It’s a situation of Overbought); if then the Cci starts to fall and goes below the value of +100, the signal of decline is stronger.
– If the Cci is below the value of -100, it means that the Prices are very low and it’s a signal of a possible rise (It’s a situation of Oversold); if then the Cci starts to rise and goes above the value of -100, the signal of rise is stronger.
– A similar way to use it, is to set the values to +200 and -200 instead of +100 and -100; in this way, the signal that you will obtain, will be more reliable (But you will obtain less signal than before).
– If the Cci goes above the +100 line, it shows the strength of the current Uptrend; whereas if the Cci goes below the -100 line, it shows the strength of the current Downtrend.
– How to interpret the Divergences between Cci and Prices: Divergence means that on the Chart there is a certain movement, while the Cci does the opposite movement. There are two different types of Divergence.
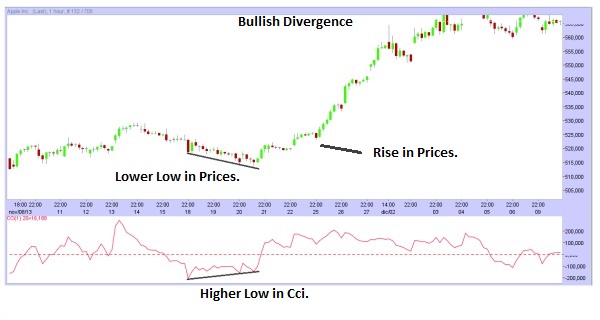
There is the Bullish Divergence, signal of a possible Rise: there is a new Lower Low in the Prices while there is a new Higher Low in the Cci (So in the Prices there is a decline, while in the Cci there is a rise); that is a signal of a possible Rise in the Prices.
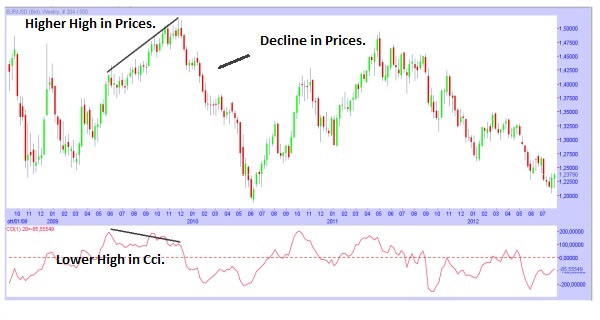
There is the Bearish Divergence, signal of a possible Decline: there is a new Higher High in the Prices while there is a new Lower High in the Cci (So in the Prices there is a rise, while in the Cci there is a decline); that is a signal of a possible Decline in the Prices.
– The Divergences can also create false signals, especially if the current Trend is very strong, so it’s better if you search for a confirmation of the Divergence. In case of a Bullish Divergence, you can have a confirmation from the break of a Resistance by the Prices, or if the Cci reach the Zero Line and goes above the Zero Line. Whereas, in case of a Bearish Divergence, you can have a confirmation from the break of a Support by the Prices, or if the Cci reach the Zero Line and goes below the Zero Line.


![Binance Review: How the Crypto Exchange Works [2024]](https://www.feedroll.com/wp-content/uploads/2024/03/binance-trading-100x100.png)


