
One fundamental concept of the technical analysis is the trend lines; the Prices always move following a “Trend”. The trend is the direction in which the prices are moving and the prices can move upward or move downward, so there are two types of trends: the Uptrend (also called Bullish Trend) and the Downtrend (also called Bearish Trend). There is also a third type of Trend: The Sideways Trend, that occurs when in the Prices there is not a real Trend; it means that the Prices remain at the same level, moving in a “Range” (It means that the Prices are not reaching new Highs or Lows).
Types of Trend
It’s very important to know the Trend of prices of an Asset; if you can identify a Trend, it can be highly profitable because you will be able to trade with the Trend.
If for example we have some shares of Google, and we know that the trend in the prices of these shares is an Uptrend, surely we will not sell our Shares aware that prices are rising and will continue to rise. If we do not have these shares, we will probably decide to buy them, knowing that prices are rising because they are in an Uptrend. Whereas, if we know that the Trend in the prices of these shares is a Downtrend, if we have these shares we will sell them (to avoid future losses) or if we do not have these shares, we will certainly not buy them (Because of the Downtrend).
There are three types of Trend, according to the Dow Theory (That classifies the Trend depending on their length); these three trend can also occur at the same time (For example the Main Trend can be un Uptrend, but the current Short Trend is a Downtrend):
- Primary or Main Trend: is the most important, is the long-term movement of prices (its duration is at least of 12-15 months and up to several years).
- Secondary or Medium Trend: is within the Main Trend, it has a shorter duration than the Main Trend (3-4 weeks normally, at least 10 days and up to 3 months).
- Tertiary or Short Trend: is within the Secondary Trend, it has a shorter duration than the Secondary Trend (3-4 days normally).
Bullish Trend and Bearish Trend
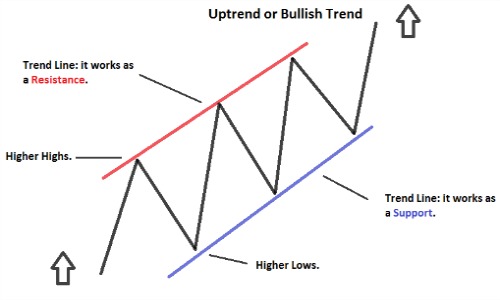
But how do we know if a Trend is Bullish or Bearish? Simple, just look at the evolution of prices. To be more specific, a Trend is bullish if the Highs and Lows in prices are gradually higher (for example the first High is 10 while the Low is 5, then the Second High is 12 and the Low 6, then the Third High is 16 and the Low is 8 , etc …).
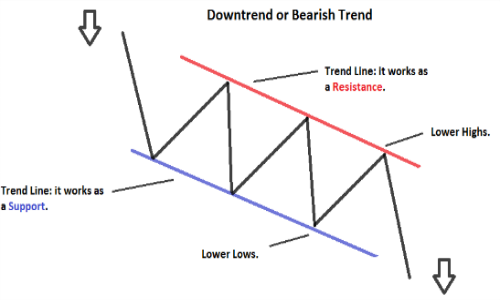
Instead, a Trend is bearish if the Lows and Highs are gradually lower (for example the first High is 21 while the Low is 17, then the Second High is 19 while the Low is 14, then the Third High is 16 while the Low is 13, etc.).
As you can see from the images, there are two lines that follow the trend (Bullish or Bearish): these are the Trend Lines (i.e. Trend lines); to draw them on a chart you need at least two points to connect with a straight line (For example two Lows in case of a Bullish trend line, that is located below the prices; two Highs in case of a Bearish trend line, that is located above the prices).
A Bullish trend line works as a support; while a Bearish trend line works as a resistance (to understand what is a support and resistance you should read this article: Resistances and Supports). The Trend Lines are used to follow the movement in prices and more Highs and Lows are used to draw the Trend Lines, more they will be reliable.



![Binance Review: How the Crypto Exchange Works [2024]](https://www.feedroll.com/wp-content/uploads/2024/03/binance-trading-100x100.png)


