We will now analyse the wedge pattern, another Pattern of the Technical Analysis. The wedge is a Pattern of Continuation or Reversal. Let’s analyze it point by point. Remember, that in order to understand better the Pattern of the technical analysis, you should know how the Trend Lines and Resistances/Supports work (For this reason we suggest you to read: What is a Trend and what are Trend Lines; Resistance and Supports).
Features of the Wedge Pattern
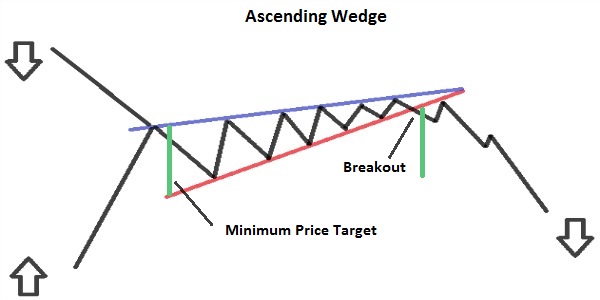
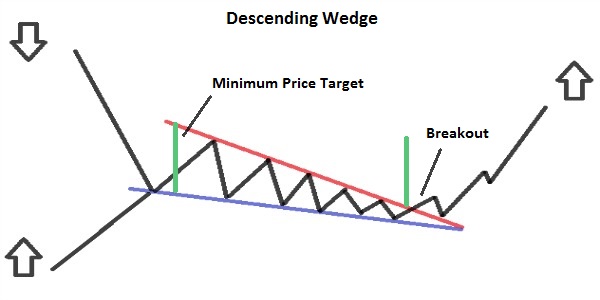
– General Features: it is similar to a symmetrical triangle, but is rather long and narrow, where both sides are sloped or upwards or downwards. (Unlike the symmetrical triangle which sides were sloped in the opposite direction).
– Wedge Types: can be Ascending or Descending. An Ascending wedge is usually a bearish Pattern, regardless of the Trend in which it is located (a wedge is Ascendant if it has both sides sloped upwards). A Descending wedge is usually a bullish Pattern, regardless of the Trend in which it is located (a wedge is Descending if it has both sides sloped downward).
– When it occurs: Pattern that occurs in an Uptrend or a Downtrend.
– Volumes: normally decrease during the formation of the Pattern; while during the Breakout should increase.
– Duration: Usually the duration is from two weeks up to two months.
– The prices have to bounce within the Wedge at least four times, so there must be at least two Highs and two Lows.
– The two lines are convergent towards the right apex, and they compress more and more the prices.
– Breakout: Occurs when prices breaks above or below one side of the wedge (that are a Resistance and a Support). Often prices test the resistance/support just cutted with a Pullback (There is a Pullback when the Prices return to the line that they have just cutted, then bounce on the line and come back to continue in their initial direction).
– Minimum Price Target: you have to measure the width of the wedge from the High/Low at the beginning of the Pattern, and then project it from the Breakout point in the direction of prices.


![Binance Review: How the Crypto Exchange Works [2024]](https://www.feedroll.com/wp-content/uploads/2024/03/binance-trading-100x100.png)


