Once you know the concept of trends and Trend Lines (If you do not know, you should read our article: What is a Trend and what are Trend Lines), is easier to understand the Resistances and Supports; a Trend can be delimited by two Trend Lines: a bottom line, called Support, and a top line, called Resistance.
Support
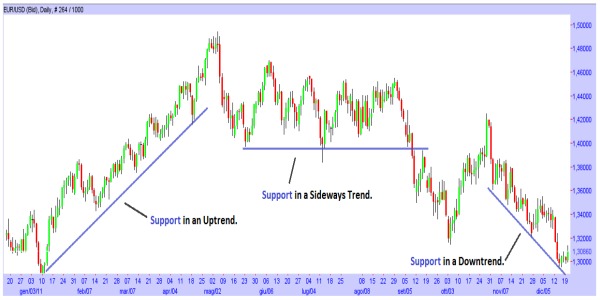
The two lines have two different meanings and functions. A support is a line that is located below the movement of the Prices and is the “level” where the prices should not fall below; The Support is a straight line, and you need at least two Lows for drawing it and more Lows you use, more reliable will be the Support. Theoretically, when prices during a decline reach this line, they should “bounce on the line” and return to move upwards.
When this doesn’t happen and once the prices reached this line, continue their decline, you should be careful: it’s possible that is the beginning of a Downtrend that might lead to new Lows (So in case it occurs during an Uptrend it’s a signal of a possible reversal in the Trend of the Prices, from Uptrend to Downtrend ; whereas if it occurs during a Downtrend it’s a signal of a continuation of the Downtrend, that is becoming stronger). To have a confirmation of this decline, you should wait for the Pullback: there is a Pullback when the Prices return to the line that they have just cutted (in this case the Support), then bounce on the line and come back to continue in their initial direction (In this case a decline).
To have a further confirmation, it is recommended to use the oscillators or indicators, Candlestick Patterns or Patterns from the Technical Analysis (All topics that are explained on our website). Another concept to keep in mind is that when a Support is cutted from the Prices, it becomes a Resistance (Because now the Prices are below the line, and not above it). Another concept is related to the reliability of the Support: the more it is tested by the Prices, the more reliable will be (The Prices to test a Support, have to reach the Support, bounce on the Support and return to move Upwards).
Resistance
The two lines have two different meanings and functions. A Resistance is a line that is located above the movement of the Prices and is the “level” where the prices should not rise above; The Resistance is a straight line, and you need at least two Highs for drawing it and more Highs you use, more reliable will be the Resistance. Theoretically, when prices during a rise reach this line, they should “bounce on the line” and return to move downwards.
When this doesn’t happen and once the prices reached this line, continue their rise, you should be careful: it’s possible that is the beginning of an Uptrend that might lead to new Highs (So in case it occurs during a Downtrend it’s a signal of a possible reversal in the Trend of the Prices, from Downtrend to Uptrend ; whereas if it occurs during an Uptrend it’s a signal of a continuation of the Uptrend, that is becoming stronger). To have a confirmation of this rise, you should wait for the Pullback: there is a Pullback when the Prices return to the line that they have just cutted (in this case the Resistance), then bounce on the line and come back to continue in their initial direction (In this case a rise).
To have a further confirmation, it is recommended to use the oscillators or indicators, Candlestick Patterns or Patterns from the Technical Analysis (All topics that are explained on our website). Another concept to keep in mind is that when a Resistance is cutted from the Prices, it becomes a Support (Because now the Prices are above the line, and not below it). Another concept is related to the reliability of the Resistance: the more it is tested by the Prices, the more reliable will be (The Prices to test a Resistance, have to reach the Resistance, bounce on the Resistance and return to move Downwards).


![Binance Review: How the Crypto Exchange Works [2024]](https://www.feedroll.com/wp-content/uploads/2024/03/binance-trading-100x100.png)


