Let’s analyse the Symmetrical Triangle Pattern, another Pattern of the Technical Analysis. The Symmetrical Triangle is a Continuation or Reversal Pattern. Let’s analyse it point by point. Remember, that in order to understand better the graphic figures of technical analysis, you should know how Trend Lines and Resistances/Supports work (For this reason we suggest you to read: What is a Trend and what are Trend Lines; Resistance and Supports).
Features of Symmetrical Triangle Pattern
– When it occurs: In an Uptrend or Downtrend; the longer the trend is, the more reliable the Pattern is (if it lasts for months it’s better).
– You need at least 4-6 points to form the two “sides” of the symmetrical triangle; the Highs of the symmetrical triangle should be gradually lower, while the Lows should be gradually higher.
– Duration: can last weeks or months; the normal duration is three months (if it lasts less than 3 weeks, is considered a Pennant, another Pattern of the technical analysis links).
– Volumes: During the formation of the Pattern, volumes are expected to decrease; Once prices reach the Breakout point, volumes should increase (Especially if it is a Bullish Breakout).
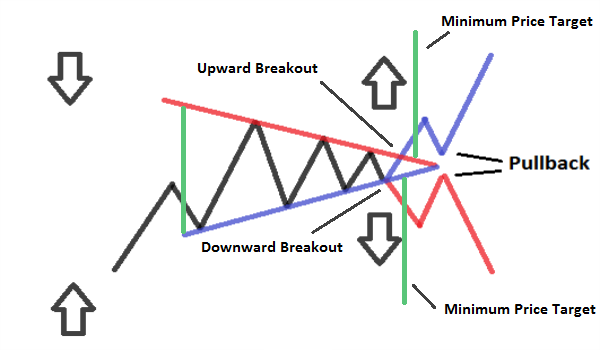
– Breakout: it must not be too close to the right apex of the symmetrical triangle, or not before the half of the side where the Breakout occurs; typically occurs between the 50% -75% of the length of the side where the Breakout occurs. The direction that the Prices will take after the Pattern (If they will rise or fall) can only be known when the Breakout occurs. After the Breakout there is often a Pullback (there is a Pullback when the Prices return to the line that they have just cutted, then bounce on the line and come back to continue in their initial direction). Some Traders apply a filter to the Prices (3% of change) or a period of time (3 days), to verify the validity of the Breakout (For example, If prices differ by more than 3% after the Breakout, there is the final confirmation of the Breakout; or if the movement that can be a rise or decline, after the breakout continues for more than 3 Days, there is the final confirmation of the Pattern).
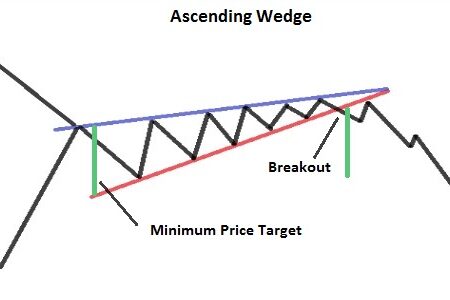
– Minimum Price Target: there are two different methods to measure the minimum Target Price. You can do as for the Right Triangles (Ascending and Descending), so measuring and projecting the length of the third side from the point of Breakout in the direction of the Prices. Or, you can draw a line that is parallel to the side of the triangle where the Breakout has not occurred, and project it from the first High or Low (depending on which side is) of the triangle.


![Binance Review: How the Crypto Exchange Works [2024]](https://www.feedroll.com/wp-content/uploads/2024/03/binance-trading-100x100.png)


