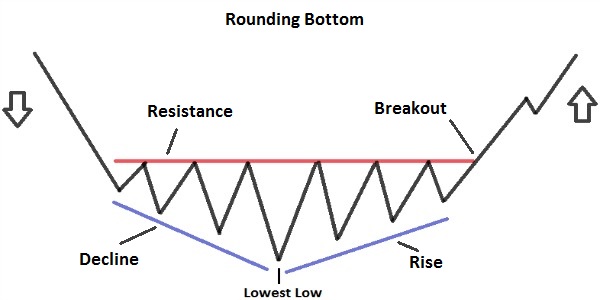
Let’s analyse the Rounding Bottom Pattern, another Pattern of the Technical Analysis. The Rounding Bottom is a Reversal Pattern. Let’s analyse it point by point. Remember, that in order to understand better the Patterns of the technical analysis, you should know how Trend Lines and Resistances/Supprots work (For this reason we suggest you to read: What is a Trend and what are Trend Lines; Resistance and Supports).
Features of the Rounding Bottom Pattern
– When it occurs: Pattern that occurs in a Downtrend.
– The first part of the Pattern is a decline that leads to the formation of the Lowest Low of the whole Pattern.
– The second part of the Pattern is a rise, and should be long as the first part of the Pattern.
– Breakout: occurs when prices break above (Go from below to above) the Resistance of the Pattern; Resistance that you plot starting from the Highest High that there is during the Pattern.
– Volumes: The volumes of exchanges should follow the formation of the Pattern. So during the First part of the Pattern, volumes should be low and declining; whereas during the Second part of the Pattern, volumes should be high and increasing.
– Duration: the duration of the Pattern can vary from several weeks up to several months, because it is a long-term Pattern.
– Target Price: there is not a method to calculate it, but you should look at the length of the Previous Trend and the length and width of the Pattern itself. It can happen that the Price Target equals the 100% of the length of the Previous Trend, or even more in some cases.


![Binance Review: How the Crypto Exchange Works [2024]](https://www.feedroll.com/wp-content/uploads/2024/03/binance-trading-100x100.png)


