We will now analyse the Rectangle Pattern, another Pattern of the Technical Analysis. The Rectangle is a Continuation or Reversal Pattern, that represent a congestion of the Prices. Let’s analyze it point by point. Remember, that in order to understand better the graphic figures of technical analysis, you should know how the Trend Lines and Resistances/Supports work (For this reason we suggest you to read: What is a Trend and what are Trend Lines; Resistance and Supports).
Features of the Rectangle Pattern
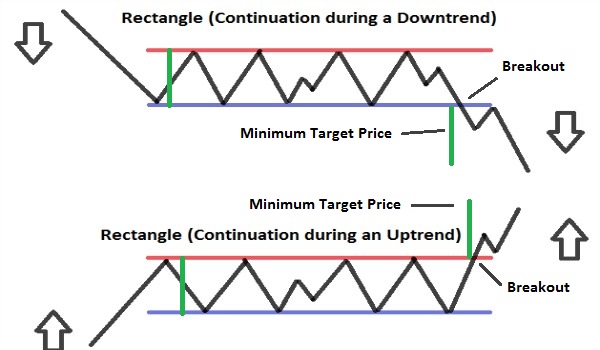
– When it occurs: The Pattern occurs during an Uptrend or Downtrend; the longer the trend is, the more reliable the Pattern is (if it lasts for months it’s better).
– The Highs and Lows that the Prices reach oscillating inside the rectangle, must be near or at the same level (Deviation of not more than 3% between the Highs and between the Lows). To form the rectangle, there must be at least 2 Lows and 2 Highs.
– Volumes: normally decrease or Low during the formation of the Pattern ; while during the Breakout should increase.
– Duration: can last from a few weeks up to several months (if the rectangle is shorter than 3 weeks, is considered a Flag), usually the duration is 3 months (For the long-term Patterns). The longer the duration of the Pattern, more important will be the Rise/Fall that will follow the Breakout.
– Width: the larger the rectangle, the more indecision will be in the market. Patterns that are wide and slow (months or years of duration) are Reversal Patterns; Instead Patterns that are “faster” and less wide (days or weeks of duration), are Continuation Patterns.
– Breakout: Occurs when prices go out from one side of the rectangle; to know in which direction the Prices will go after the Pattern (If there will be a rise or decline) you have to wait for the Breakout. Some Traders apply a filter to the Prices (3% of change) or a period of time (3 days), to verify the validity of the Breakout (For example, If prices differ by more than 3% after the Breakout, there is the final confirmation of the Breakout; or if the movement that can be a rise or decline, after the breakout continues for more than 3 Days, there is the final confirmation of the figure). However it often occurs that the side of the Rectangle just cutted from the Prices is “tested” with a Pullback and that is a further confirmation (There is a Pullback when the Prices return to the line that they have just cutted, then bounce on the line and come back to continue in their initial direction).
– Minimum Target Price: you have to measure the width of the rectangle, and project it from the Breakout point in the direction of prices.
– Opportunity of Trading: once recognized the formation of the rectangle, you can take advantage of the price fluctuation that occurs inside the Rectangle to make Profitable Trades, before prices leave the rectangle.


![Binance Review: How the Crypto Exchange Works [2024]](https://www.feedroll.com/wp-content/uploads/2024/03/binance-trading-100x100.png)


