We will now analyse the flags and Pennants Pattern, two other Patterns of the technical analysis. Flags and Pennants are short-term continuation patterns ; are among the most reliable Patterns and they represent “short breaks” (not longer than 20 sessions) during a Trend, before the Trend continues to go in the initial direction. Let’s analyze them point by point. Remember, that in order to understand better the Patterns of the technical analysis, you should know how the Trend Lines and Resistances/Supports work (For this reason we suggest you to read: What is a Trend and what are Trend Lines; Resistance and Supports).
Features of Flags and Pennants Pattern
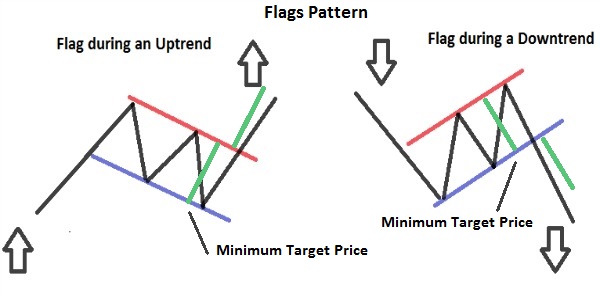
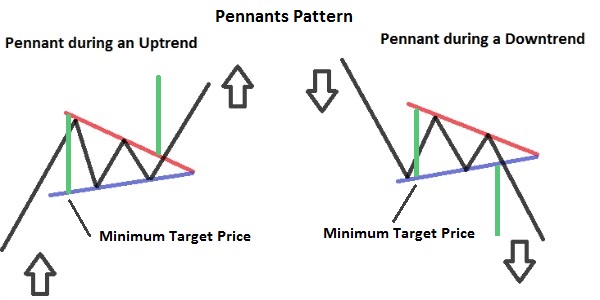
– When they occur: both Patterns occur during a strong Uptrend or strong Downtrend, that have high volumes of exchanges.
– What are: The Pennants are similar to the Pattern of the symmetrical Triangle, but they have a shorter duration and they are smaller (They are also similar to another Pattern, The wedge). The Flags are similar to the Pattern of the rectangle, but they have a shorter duration and they are smaller.
– In Flags, prices are contained between two parallel lines.
– In Pennants, prices are contained between two convergent lines.
– Duration: both figures, can last from 1 to 12 weeks and should normally last from 1 to 4 weeks (if they are over 12 weeks, a Pennant would be classified as a symmetrical triangle while a Flag as a rectangle). If they last between 8-12 weeks, their reliability as Patterns is less.
– Volumes: High during the Trend that precedes these Patterns; Decreasing and Low, during the formation of these Patterns. Then, rising in the Breakout point (When the Prices go out the Pattern).
– Breakout: although they are usually continuation patterns, it’s always better to wait for the Breakout from one side of the Patterns to be sure whether there will be a rise or a decline. Finding other confirmations (From oscillators or of Candlestick Patterns), and even a Pullback it would be better (There is a Pullback when the Prices return to the line that they have just cutted, then bounce on the line and come back to continue in their initial direction).
– Minimum Target Price: you have to measure the width of the Pattern, and project it from the point of Breakout upward or downward (depending on whether prices have gone out from the Pattern with a rise or a decline).


![Binance Review: How the Crypto Exchange Works [2024]](https://www.feedroll.com/wp-content/uploads/2024/03/binance-trading-100x100.png)


