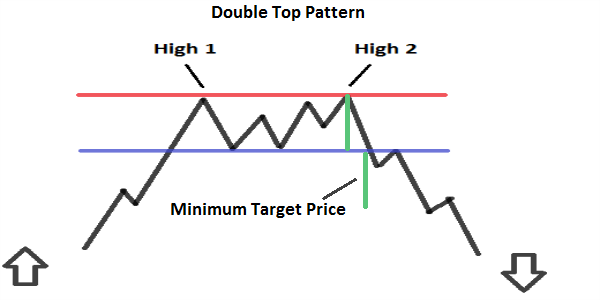
Let’s analyze now the Double Top Pattern, another Pattern of the technical analysis. The Double Top is a Reversal Pattern. Let’s analyze it point by point. Remember, that in order to understand better the Pattern of the technical analysis, you should know how the Trend Lines and Resistances/Supports work (For this reason we suggest you to read: What is a Trend and what are Trend Lines; Resistance and Supports).
Features of Double Top Pattern
– Pattern composed by: two Highs that reach the same level.
– Located in an uptrend; the longer the trend is, the more reliable the Pattern is (if it lasts for months it’s better).
– First High (1): must be the Highest High of the current Uptrend. Immediately after the High there is a decline so the Prices must fall of (at least) the 10% of the value of the price compared to the first High (1).
– Subsequently, there is a period of “ranging” prices, where prices begin to oscillate but they remain at the same level (In a certain range).
– The Second High (2): must be at the same level of the Previous High (1) (or there is a slight deviation of not more than 3% of the price of the Previous High). The period of time between an High and the other, varies from a few weeks up to several months (usually is 1-3 months and it’s better if the period of time is greater than 1 month, for the long-term Patterns).
– The decline that begins after the Second High (2), should have High volumes or at least Higher than the Previous ones.
– Break of the Support: once that the prices break below (Go from above to below) the Support, the Pattern is completed (There should be an increase in volumes). The Broken Support, now becomes a Resistance (that can sometimes be tested by prices, before continuing the decline).
– Minimum Price Target: you have to measure the distance between the support and one of the two Highs, and then project it from the break of the Support (Support that you plot from the Lowest Low that there is in the period of “ranging” prices ).


![Binance Review: How the Crypto Exchange Works [2024]](https://www.feedroll.com/wp-content/uploads/2024/03/binance-trading-100x100.png)


