Let’s analyse the Right Triangle in the Ascending form and in the Descending form, another Pattern of the Technical Analysis. The Ascending/Descending Right Triangle is a Continuation Pattern. Let’s analyse it point by point. Remember, that in order to understand better the graphic figures of technical analysis, you should know how Trend Lines and Resistances/Supports work (For this reason we suggest you to read: What is a Trend and what are Trend Lines; Resistance and Supports).
Features of Ascending and Descending triangles
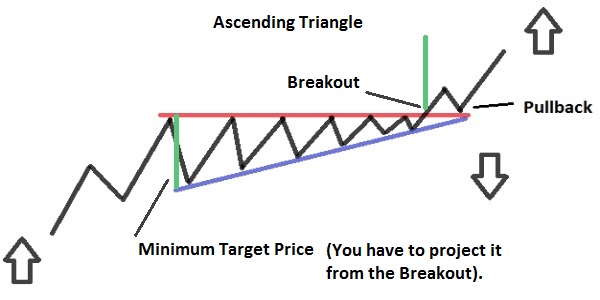
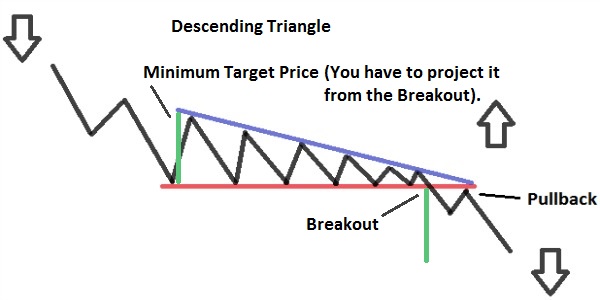
– When it occurs: The Ascending Triangle occurs in an Uptrend; The Descending Triangle occurs in a Downtrend.
– The sides of the triangle: In case of the Ascending Triangle, the Upper side is horizontal and the Lower side is sloped; the prices move within the Triangle, being compressed more and more (The Highs remain always close to the same level, while the Lows are increasing). In case of the Descending Triangle, the Lower side is horizontal, while the Upper side is sloped; the prices move within the triangle, being compressed more and more(The Lows remain always close to the same level, while the Highs are decreasing). In both triangles, prices must “bounce” inside the triangle at least 4-6 times before the Breakout point.
– Duration of the triangle: can last from a few weeks up to several months (The normal duration is 1-3 months in case of a long-term Pattern).
– Volumes: During the formation of both triangles, volumes are expected to decrease; Once prices reach the Breakout point, volumes should increase.
– Breakout: In case of the Ascending Triangle, the prices should go out from the Upper side (That is the horizontal side) of the Triangle so there will be a rise in Prices (There can be a Pullback; there is a Pullback when the Prices return to the line that they have just cutted, then bounce on the line and come back to continue in their initial direction). In case of the Descending Triangle, the Prices should go out from the Lower side (that is the horizontal side) of the Triangle so there will be a decline in Prices (There can be a Pullback).
– Minimum Target Price: you have to measure the third side of the ascending/descending triangle, that is the base of the triangle. Then, you have to project it from the Breakout point upwards, in case of the Ascending Triangle; downwards, in case of the Descending Triangle.


![Binance Review: How the Crypto Exchange Works [2024]](https://www.feedroll.com/wp-content/uploads/2024/03/binance-trading-100x100.png)


