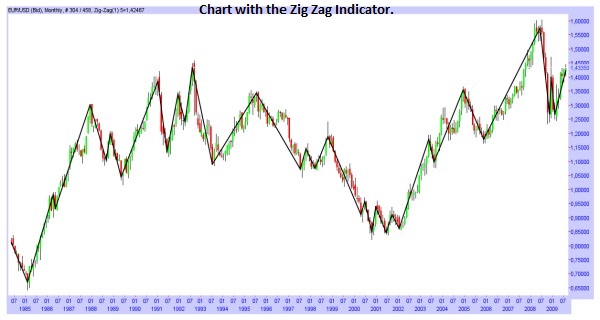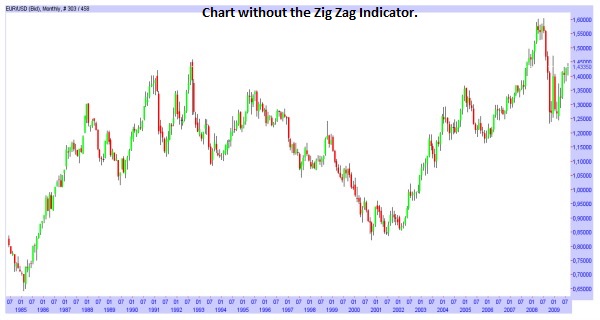
The Zig Zag Indicator filters out the changes of the Prices that are below a certain fixed percentage; it is used to identify the main movements of a Trend and to eliminate the movements caused by the “noise” of the Prices (All the oscillations of the Prices that are not important and can lead to false signals).
General Features of the Zig Zag Indicator
– The Zig Zag is very useful to identify the points of reversal and correction of a Trend, but it can also be used with the Waves of Elliott or the Fibonacci tools.
– With the Zig Zag you can identify in a better way the points of High and Low; but also to identify the Patterns from the Technical Analysis or Supports and Resistances.
– It is used to obtain the confirmation of the direction of a Trend.
– All the positive things of the Zig Zag are limited by the nature of the Zig Zag itself: the Zig Zag is based on the retrospective analysis of data, so the last point (The one that is most recent) of the Indicator and the line that will connect this point to the previous one, will be plotted only when you know the future Prices.


![Binance Review: How the Crypto Exchange Works [2024]](https://www.feedroll.com/wp-content/uploads/2024/03/binance-trading-100x100.png)


