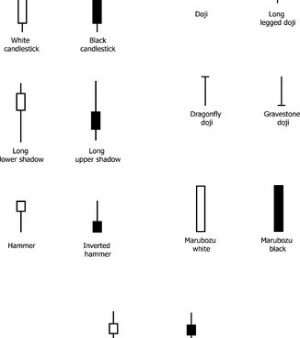
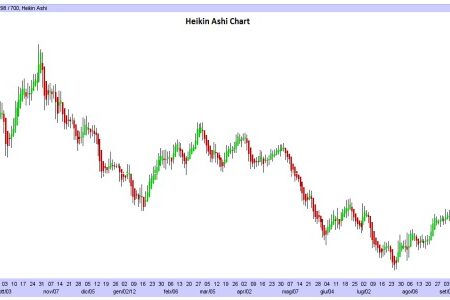
For a better understanding of this article, you should already know what Japanese Candlesticks are and all their features; for this reason, we suggest you to read this introductory article to Japanese Candlesticks: Japanese Candlestick Chart ( So that you can understand also the Ratings given to the Candlestick Patterns for the “quality” of the signal and for their frequency to “appear” on Charts).
Let’s analyze now the following Candlestick Patterns: “8 New Price Lines”, “10 New Price Lines”, “12 New Price Lines” and “13 New Price Lines”.
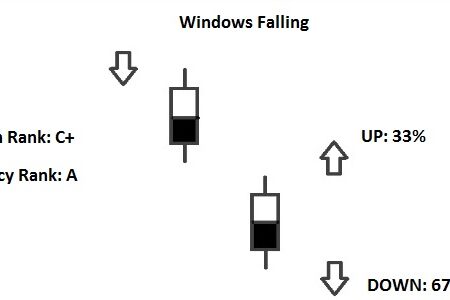
New Price Lines
– Normally it should be a signal of bearish reversal of the current Trend.
– You can find it in the variants: 8 New Price Lines, 10 New Price Lines, 12 New Price Lines and 13 New Price Lines, depending on how many candles is composed the Pattern.
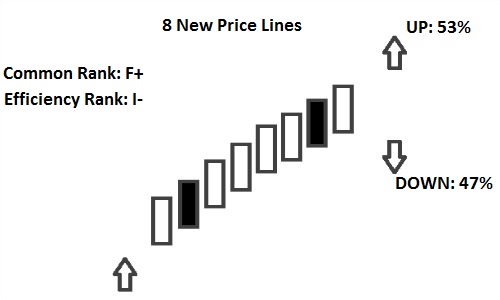
8 New Price Lines
– It occurs during an Uptrend; confirmation is required by the candles that follow the Pattern.
– The Pattern is characterized by eight consecutive candles, each with a higher High.
– To obtain a further confirmation of the Pattern, you should check the Close of the last Candle Line: if it is over the Top of the Real Body of the Previous Candle, there are more chances that there will be a rise in Prices. If the Close is below the Top of the Real Body of the Previous Candle , there are more chances that there will be a fall in Prices.
10 New Price Lines
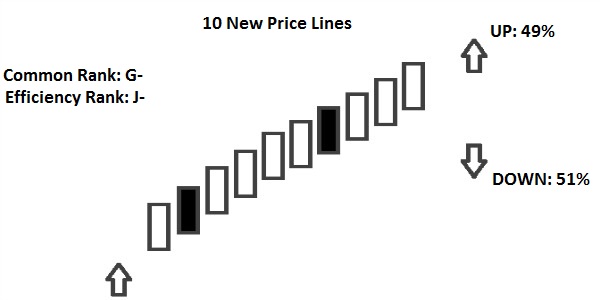
– It occurs during an Uptrend; confirmation is required by the candles that follow the Pattern.
– The Pattern is characterized by ten consecutive candles, each with a higher High.
– To obtain a further confirmation of the Pattern, you should check the Close of the last Candle Line: if it is over the Top of the Real Body of the Previous Candle, there are more chances that there will be a rise in Prices. If the Close is below the Top of the Real Body of the Previous Candle , there are more chances that there will be a fall in Prices.
12 New Price Lines
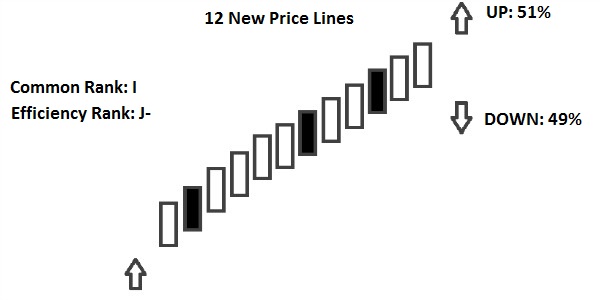
– It occurs during an Uptrend; confirmation is required by the candles that follow the Pattern.
– The Pattern is characterized by twelve consecutive candles, each with a higher High.
– To obtain a further confirmation of the Pattern, you should check the Close of the last Candle Line: if it is over the Top of the Real Body of the Previous Candle, there are more chances that there will be a rise in Prices. If the Close is below the Top of the Real Body of the Previous Candle , there are more chances that there will be a fall in Prices.
13 New Price Lines
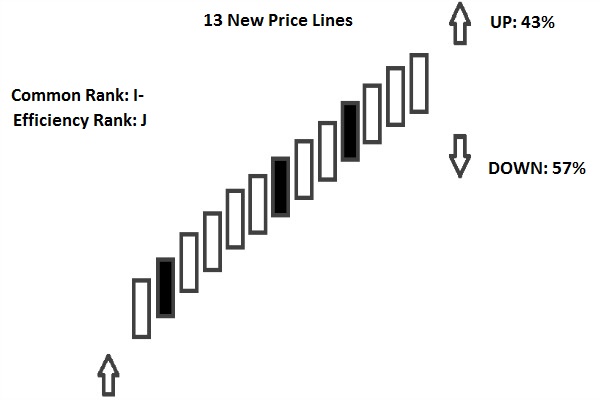
– It occurs during an Uptrend; confirmation is required by the candles that follow the Pattern.
– The Pattern is characterized by thirteen consecutive candles, each with a higher High.
– To obtain a further confirmation of the Pattern, you should check the Close of the last Candle Line: if it is over the Top of the Real Body of the Previous Candle, there are more chances that there will be a rise in Prices. If the Close is below the Top of the Real Body of the Previous Candle , there are more chances that there will be a fall in Prices.


![Binance Review: How the Crypto Exchange Works [2024]](https://www.feedroll.com/wp-content/uploads/2024/03/binance-trading-100x100.png)


