
The Japanese Candlestick Chart is one of the most important and used charts, that allow us to have more information about the movements of the Prices. As you can easily understand from the name itself, the Candlestick Chart was created in Japan by Munehisa Homma and was used for the first time during the XVIII century to predict the movement of the prices of the rice. The names assigned to the Patterns that you can find on a Candlestick Chart, were taken from the japanese military vocabulary (Of the XVIII century of course).
The Candlestick Chart was introduced in Europe by Steve Nison in the 1989: the Chart itself and some of the Candlestick Patterns were explained in his book “Japanese Candlestick Charting Techniques”. The analysis of the Candlestick Chart can be used with Technical Analysis and its graphical patterns, but also with oscillators and indicators.
Japanese Candlestick Chart
As you can see from the previous image, the chart is composed by bars that are similar to Candles: each bar is called “Candle Line” or just Candle. A Candle can be of two different colors: one color represents a rise in Prices the other one represents a decline in Prices. Normally, the pairs of colors are the following: White and Black (Rise and Decline), Green and Red (Rise and Decline), Orange and Blue (Rise and Decline), Blue and Red (Rise and Decline).
Each Candle is created with a data set that contains:
1) Opening Price of the Session;
2) Closing Price of the session;
3) Low of the Session;
4) High of the Session.
The “Session” is the period of time that you choose for the Candles: so if, for example, we choose the 15 minutes Timeframe for each candle, it means that each Candle on the Chart will represent 15 minutes of trades; going on withe the example, it means that from the analysis of a Candle, we can know the High and the Low in prices during the 15 minutes of trades and also the initial Price (Opening Price) and the final Price (Closing Price): with all these information, we can better understand the movements of the Prices. Of course, there are different timeframes for the Candles among which you can choose (From seconds to minutes, from hours to days, weeks or months).
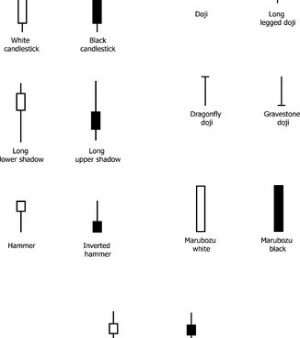
Features of Candles
Each Candle has the following four features, as you have seen from the previous image:
1) Real Body: is the “Body” of the Candle, it shows the price excursion from the Opening Price (Called Open on the Candle) and the Closing Price (Called Close on the Candle) for the period chosen.
2) Shadows: are the thin bars of the Candle, that are above and below the Real Body of the Candle; they represent the High in the prices (Upper Shadow) and the Low in the prices (Lower Shadow) for the period chosen.
3) High and Low: are the tip of the Shadows (Upper and Lower); they represent the Highest value in the prices and the Lowest value in the prices for the period chosen.
4) Color: a Candle can be of two different colors, depending on whether they represent a Rise or a Decline in Prices; if a Candle shows a rise, it means that the Closing price is higher than the Opening price, whereas if it shows a fall, it means that the Closing price is lower than the Opening price.
In our examples on the website, we use the pairs “White/Black” to show a Rise or a Decline in prices.
Candlestick Patterns
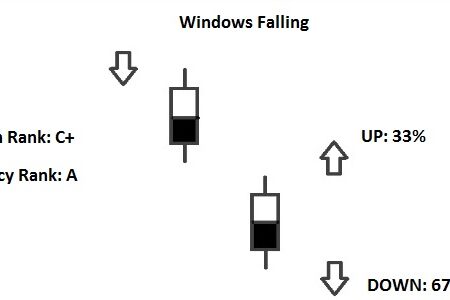
On our website we explain the most important Candlestick Patterns and we also give to the Patterns a rating depending on their reliability and frequency with which they “appear” on the Charts. Now we are going to explain to you how you have to interpret our ratings with an example:
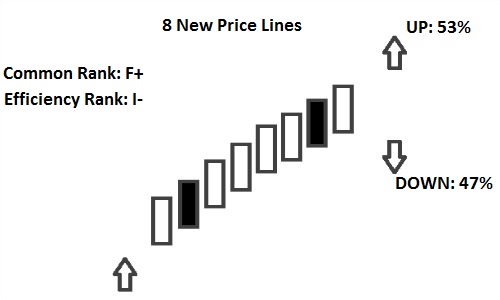
- 8 New Price Lines:This is the name of the Candlestick Pattern.
- UP 53% :The probability that after the Pattern there will be a Rise in Prices.
- DOWN 47%:The probability that after the Pattern there will be a Decline in Prices.
- Common Rank:This is the rating for the frequency with which the Pattern appear on the Charts; we use an alphabetical order to evaluate the performance of the Candlestick Pattern, where A+ is the best rating possible and J- the worst rating possible.
- Efficiency Rank:This is the rating for the performance of the Candlestick Pattern, to be more specific for the movement of the Prices after the Pattern (Rise or Decline). If the Efficiency Rank is higher, it means that after the Pattern the Prices will move in a stronger way in the direction suggested by the Pattern. we use an alphabetical order to evaluate the performance of the Candlestick Pattern, where A+ is the best rating possible and J- the worst rating possible.
This is the alphabetical order used for the ratings: each letter corresponds to a value.
- 0-10: 1,2,3 (A+) // 4,5,6,7 (A) // 8,9,10 (A-)
- 11-20: 11,12,13 (B+) // 14,15,16,17 (B) // 18,19,20 (B-)
- 21-30: 21,22,23 (C+) // 24,25,26,27 (C) // 28,29,30 (C-)
- 31-40: 31,32,33 (D+) // 34,35,36,37 (D) // 38,39,40 (D-)
- 41-50: 41,42,43 (E+) // 44,45,46,47 (E) // 48,49,50 (E-)
- 51-60: 51,52,53 (F+) // 54,55,56,57 (F) // 58,59,60 (F-)
- 61-70: 61,62,63 (G+) // 64,65,66,67 (G) // 68,69,70 (G-)
- 71-80: 71,72,73 (H+) // 74,75,76,77 (H) // 78,79,80 (H-)
- 81-90: 81,82,83 (I+) // 84,85,86,87 (I) // 88,89,90 (I-)
- 91-100: 91,92,93 (J+) // 94,95,96,97 (J) // 98,99,100 (J-)


![Binance Review: How the Crypto Exchange Works [2024]](https://www.feedroll.com/wp-content/uploads/2024/03/binance-trading-100x100.png)


