For a better understanding of this article, you should already know what Japanese Candlesticks are and all their features; for this reason, we suggest you to read this introductory article to Japanese Candlesticks: Japanese Candlestick Chart ( So that you can understand also the Ratings given to the Candlestick Patterns for the “quality” of the signal and for their frequency to “appear” on Charts).
Let’s analyse now the following Candlestick Pattern: “Thrusting Line”.
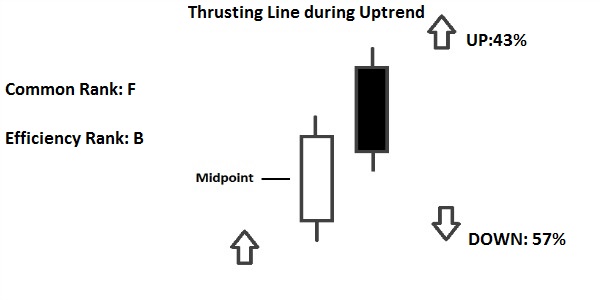
Thrusting Line
– Normally it should be a signal of continuation of the current Trend.
– It occurs during a Downtrend or an Uptrend; confirmation is required by the candles that follow the Pattern.
– The Pattern is characterized by Two Candles of opposite color (Black and white in case of a Downtrend; white and black in case of an Uptrend).
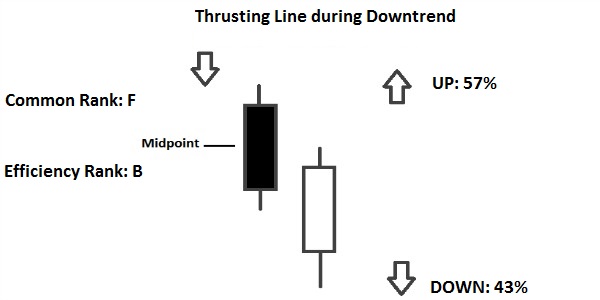
– The First Candle is long and black (In case of a Downtrend) or is long and white (In case of an Uptrend).
– The Second Candle has the Open below the Low of the First Candle, whereas it has the Close near (But below) the Midpoint of the Real Body of the First Candle (In case of a Downtrend). The Second Candle has the Open above the High of the First Candle, whereas it has the Close near (But above) the Midpoint of the Real Body of the First Candle (In case of an Uptrend).


![Binance Review: How the Crypto Exchange Works [2024]](https://www.feedroll.com/wp-content/uploads/2024/03/binance-trading-100x100.png)


