For a better understanding of this article, you should already know what Japanese Candlesticks are and all their features; for this reason, we suggest you to read this introductory article to Japanese Candlesticks: Japanese Candlestick Chart ( So that you can understand also the Ratings given to the Candlestick Patterns for the “quality” of the signal and for their frequency to “appear” on Charts).
Let’s analyse now the following Candlestick Pattern: “Downside Tasuki Gap”.
Tasuki Gap
– Normally it should be a signal of continuation of the current Trend.
– You can find it in the variants: Upside and Downside, depending on the Trend in which is located.
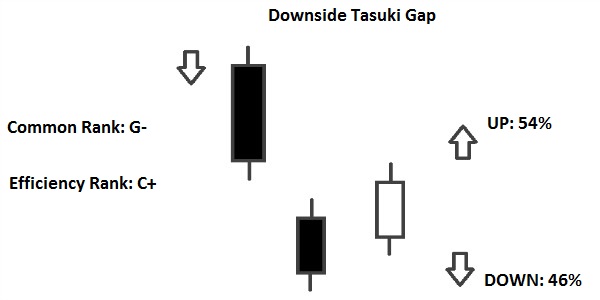
Downside Tasuki Gap
– It occurs during a Downtrend; confirmation is required by the candles that follow the Pattern.
– The First Candle is long and black.
– The Second Candle is black, it gaps down from the First Candle.
– The Third Candle is white, it has the close within the Gap Down (So it has the Close below the Real Body of the First Candle). Whereas it has the Open within the Real Body of the Second Candle (For a further confirmation of the Pattern).
– Another confirmation of the Pattern: if one of the next Candles reaches a Lower Low than the Low of the Second Candle.


![Binance Review: How the Crypto Exchange Works [2024]](https://www.feedroll.com/wp-content/uploads/2024/03/binance-trading-100x100.png)


