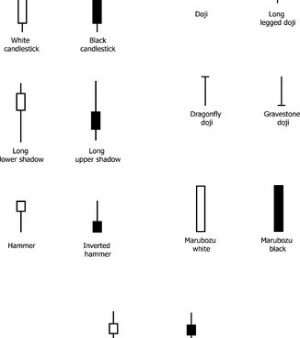
For a better understanding of this article, you should already know what Japanese Candlesticks are and all their features; for this reason, we suggest you to read this introductory article to Japanese Candlesticks: Japanese Candlestick Chart ( So that you can understand also the Ratings given to the Candlestick Patterns for the “quality” of the signal and for their frequency to “appear” on Charts).
Let’s analyse now the following Candlestick Pattern: “Takuri Line”.
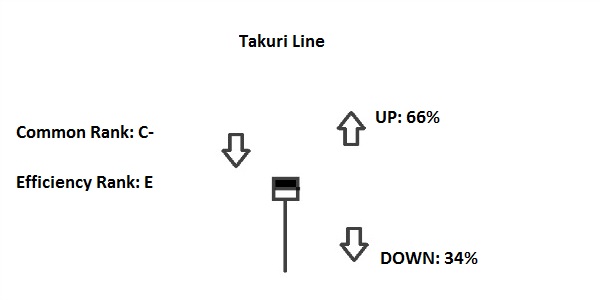
Takuri Line
– Normally it should be a signal of reversal of the current Trend.
– It occurs during a Downtrend; confirmation is required by the candles that follow the Pattern.
– It has a short Real Body, with a Lower Shadow that is long at least three times the Real Body of the Candle; the Candle has not an Upper Shadow, but if it has an Upper Shadow that is very short.
– The color of the Candle doesn’t matter (Can be white or black).


![Binance Review: How the Crypto Exchange Works [2024]](https://www.feedroll.com/wp-content/uploads/2024/03/binance-trading-100x100.png)


