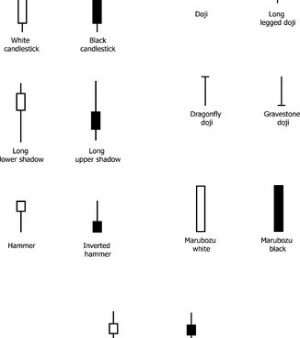
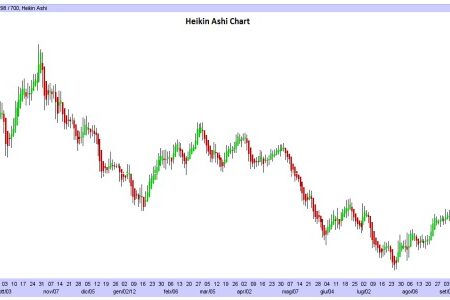
For a better understanding of this article, you should already know what Japanese Candlesticks are and all their features; for this reason, we suggest you to read this introductory article to Japanese Candlesticks: Japanese Candlestick Chart ( So that you can understand also the Ratings given to the Candlestick Patterns for the “quality” of the signal and for their frequency to “appear” on Charts).
Let’s analyse now the following Candlestick Pattern: “Scoop Pattern”.
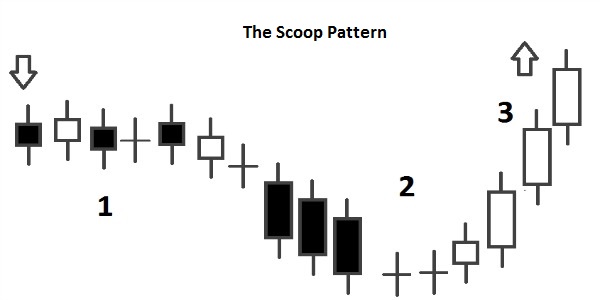
Scoop Pattern
– It occurs during a Sideways Trend; confirmation is required by the candles that follow the Pattern.
– The Pattern starts showing the indecision of the Markets (Spinning Tops, Doji, Small Candles, etc… ). (1)
– Then the Price starts to fall (Probably due to some Traders that expected a rise in the prices, but now that the trend is sideways they are selling because they do not believe anymore in a possible rise). (2)
– This decline in Prices attracts other Traders, that hope in a possible Rise in the Prices after the fall. For this reason the prices start to rise: if the prices go above the phase of indecision, it will begin a new Uptrend; if not, the Pattern will fail. (3)


![Binance Review: How the Crypto Exchange Works [2024]](https://www.feedroll.com/wp-content/uploads/2024/03/binance-trading-100x100.png)


