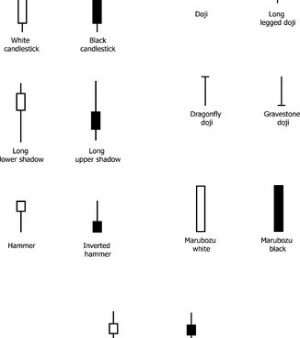
For a better understanding of this article, you should already know what Japanese Candlesticks are and all their features; for this reason, we suggest you to read this introductory article to Japanese Candlesticks: Japanese Candlestick Chart ( So that you can understand also the Ratings given to the Candlestick Patterns for the “quality” of the signal and for their frequency to “appear” on Charts).
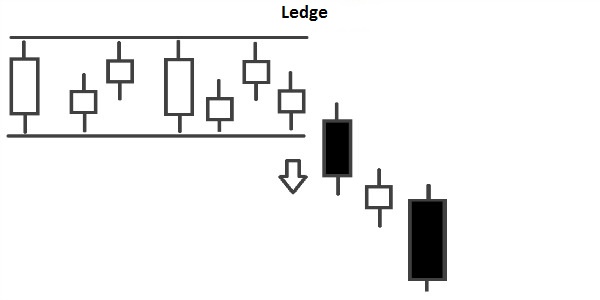
Let’s analyse now the following Candlestick Pattern: “Ledge Pattern”.
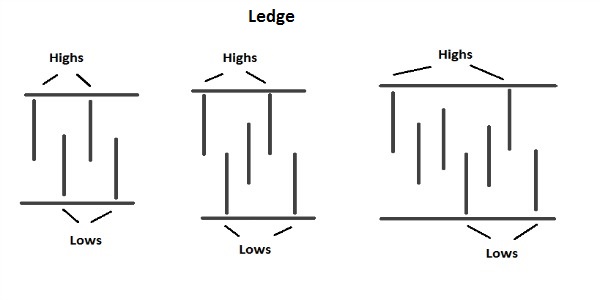
Ledge Pattern
– Pattern that shows a compression of the price volatility, so is a signal of a possible change of direction of the Prices. Normally the Breakout occurs in the same direction of the current Trend, with a Long Marubozu (If there is the Marubozu, is a confirmation of the strength of the Trend).
– The Ledge occurs when there are Highs and Lows at the same level (More or less) and they are alternated (High, Low, High, Low, etc…. ). Highs and Lows do not have to be in sequence, although it is better if they are in sequence (For examples: High, Low, Other Candles that do not make a new High, High, Other Candles that do not make a new Low, Low, etc…).


![Binance Review: How the Crypto Exchange Works [2024]](https://www.feedroll.com/wp-content/uploads/2024/03/binance-trading-100x100.png)


