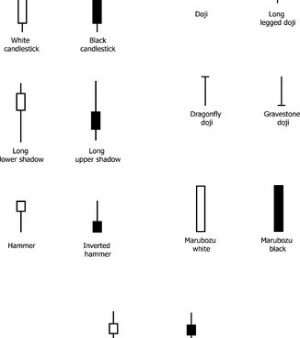
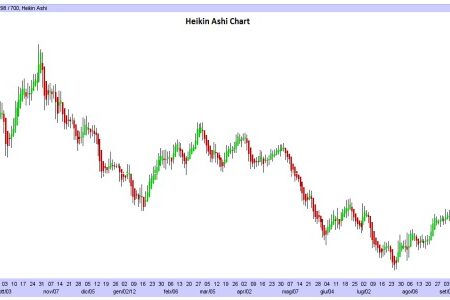
For a better understanding of this article, you should already know what Japanese Candlesticks are and all their features; for this reason, we suggest you to read this introductory article to Japanese Candlesticks: Japanese Candlestick Chart ( So that you can understand also the Ratings given to the Candlestick Patterns for the “quality” of the signal and for their frequency to “appear” on Charts).
Let’s analyse now the following Candlestick Patterns: “J-Hook Pattern” and “The Inverted J-Hook Pattern”.
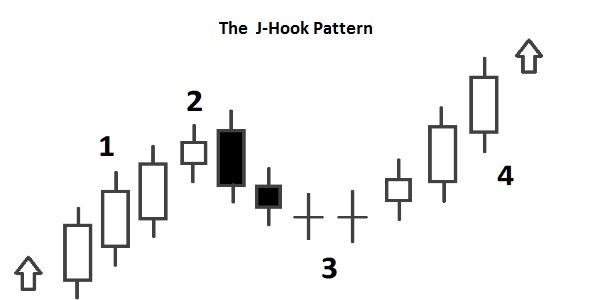
The J-Hook Pattern
– Normally it should be a signal of continuation of the current Trend.
– It occurs during an Uptrend; confirmation is required by the candles that follow the Pattern.
– The Pattern starts with a rapid increase in the Prices. (1)
– Then there is a Candlestick Pattern that gives a bearish signal (So the Traders start to sell). (2)
– The prices fall, then reach a level of “indecision”; at the end of this phase of indecision, there should be a Bullish signal. (3)
– The prices start to rise and they reach the Previous High (The one formed from the Phase (1) ). If the prices keep rising, going above this High, there should be a new Uptrend in Prices.
– If the prices don’t go above the High, the Pattern has failed; in this case the Pattern creates the Double Top Pattern (A pattern from the Technical analysis).
The Inverted J-Hook Pattern
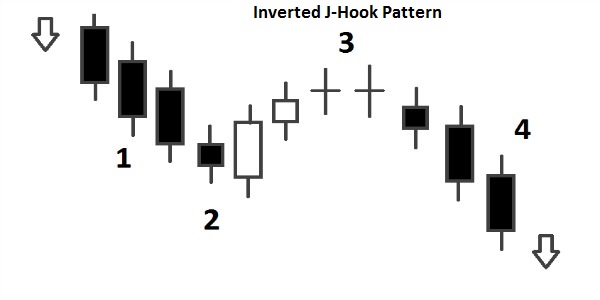
– Normally it should be a signal of continuation of the current Trend.
– It occurs during a Downtrend; confirmation is required by the candles that follow the Pattern.
– The Pattern starts with a rapid decline in the Prices. (1)
– Then there is a Candlestick Pattern that gives a bullish signal (So the Traders start to buy). (2)
– The prices rise, then reach a level of “indecision”; at the end of this phase of indecision, there should be a Bearish signal. (3)
– The prices start to fall and they reach the Previous Low (The one formed from the Phase (1) ). If the prices keep falling, going below this Low, there should be a new Downtrend in Prices.
– If the prices don’t go below the Low, the Pattern has failed; in this case the Pattern creates the Double Bottom Pattern (A pattern from the Technical analysis).


![Binance Review: How the Crypto Exchange Works [2024]](https://www.feedroll.com/wp-content/uploads/2024/03/binance-trading-100x100.png)


