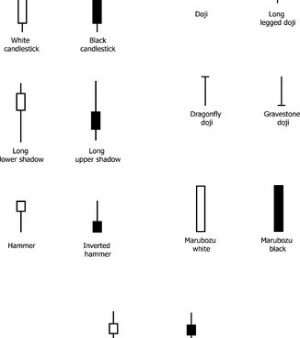
For a better understanding of this article, you should already know what Japanese Candlesticks are and all their features; for this reason, we suggest you to read this introductory article to Japanese Candlesticks: Japanese Candlestick Chart ( So that you can understand also the Ratings given to the Candlestick Patterns for the “quality” of the signal and for their frequency to “appear” on Charts).
Let’s analyse now the following Candlestick Pattern: “Harami Pattern”.
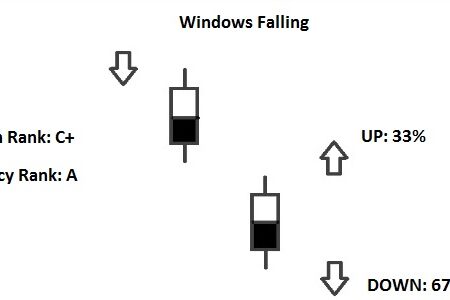
Harami Pattern
– Normally it should be a signal of reversal of the current Trend.
– You can find it in the variants: Bullish and Bearish, depending on the Trend in which is located.
– The Pattern looks like a “pregnant woman”: The Real Body of the Second Candle is fully contained within the Real Body of the First Candle.
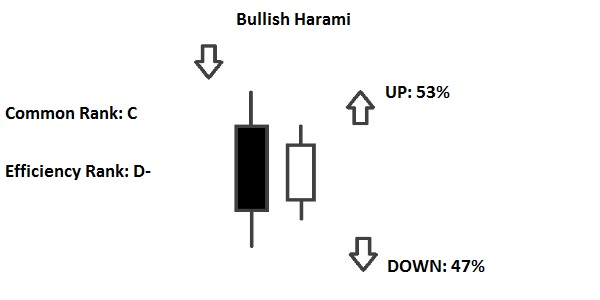
Bullish Harami Pattern
– It occurs during a Downtrend; confirmation is required by the candles that follow the Pattern.
– The First Candle is black.
– The Second Candle is white; it has the Real Body fully contained within the Real Body of the First Candle.
– Ignore the Shadows; the Highs or Lows of the Two Candles can be at the same level but not both (So only the Highs or only the Lows).
Bearish Harami Pattern
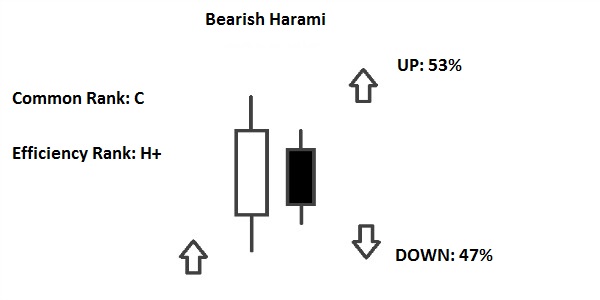
– It occurs during an Uptrend; confirmation is required by the candles that follow the Pattern.
– The First Candle is white.
– The Second Candle is black; it has the Real Body fully contained within the Real Body of the First Candle.
– Ignore the Shadows; the Highs or Lows of the Two Candles can be at the same level but not both (So only the Highs or only the Lows).


![Binance Review: How the Crypto Exchange Works [2024]](https://www.feedroll.com/wp-content/uploads/2024/03/binance-trading-100x100.png)


