For a better understanding of this article, you should already know what Japanese Candlesticks are and all their features; for this reason, we suggest you to read this introductory article to Japanese Candlesticks: Japanese Candlestick Chart ( So that you can understand also the Ratings given to the Candlestick Patterns for the “quality” of the signal and for their frequency to “appear” on Charts).
Let’s analyse now the following Type of Japanese Candle: “Doji Line”.
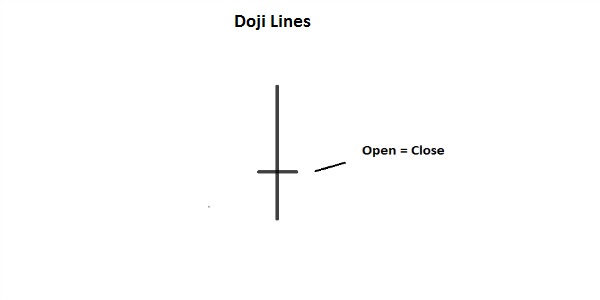
Doji Lines
– The opening price (Open of the Candle) and closing price (Close of the Candle) are at the same level, so the Candle does not have a Real body (Or in the case that it has, it is very short).
– If a Doji Line appears during a Trend, especially if it’s near an High or Low of the Trend, it means that the strength of the Trend has weakened and that there is indecision in the Markets. In the case there is more than one Doji line, one after the other, it means a congested phase in prices.
– In case of an Uptrend, the presence of a Doji Line means that the strength of the Trend has weakened, especially if the Doji Line is after a long and white Candle; the Candles that follow the Doji, will clarify the new direction of the Price. In case of a Downtrend, the Doji line has not the same level of reliability.


![Binance Review: How the Crypto Exchange Works [2024]](https://www.feedroll.com/wp-content/uploads/2024/03/binance-trading-100x100.png)


