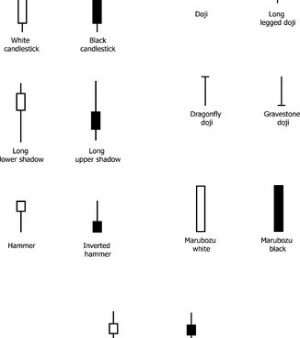
For a better understanding of this article, you should already know what Japanese Candlesticks are and all their features; for this reason, we suggest you to read this introductory article to Japanese Candlesticks: Japanese Candlestick Chart ( So that you can understand also the Ratings given to the Candlestick Patterns for the “quality” of the signal and for their frequency to “appear” on Charts).
Let’s analyse now the following Candlestick Pattern: “Breakaway Pattern”.
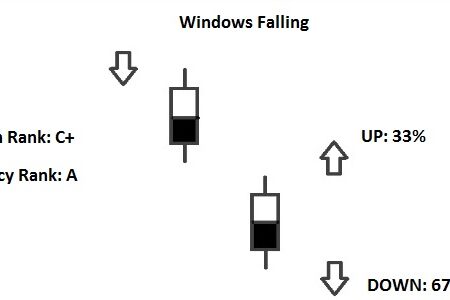
Breakaway Pattern
– Normally it should be a signal of reversal of the current Trend.
– You can find it in the variants: Bullish and Bearish, depending on the Trend in which is located.
– Is a rare Pattern and not so reliable.
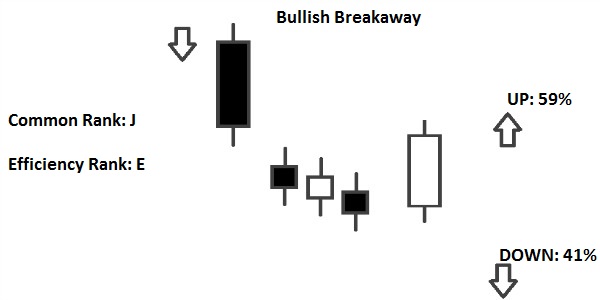
Bullish Breakaway Pattern
– It occurs during a Downtrend; confirmation is required by the candles that follow the Pattern.
– The First Candle is long and black.
– Then there is a Gap Down.
– The next Candles are Spinning Tops (With Short Real Bodies), that make new Lows (Are usually Three Candles).
– The Last Candle is long and white, it has the Close within the range of the Gap Down.
– The Second and Fourth Candle, should be black to have a further confirmation of the Pattern.
Bearish Breakaway Pattern
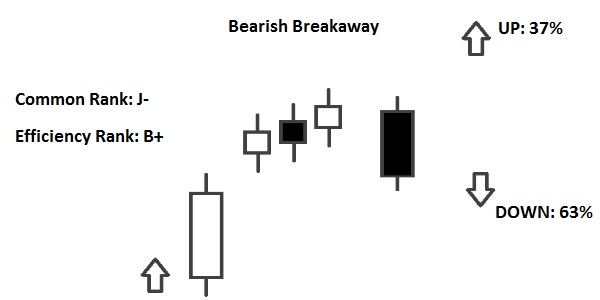
– It occurs during an Uptrend; confirmation is required by the candles that follow the Pattern.
– The First Candle is long and white.
– Then there is a Gap Up.
– The next Candles are Spinning Tops (With Short Real Bodies), that make new Highs (Are usually Three Candles).
– The Last Candle is long and black, it has the Close within the range of the Gap Up.
– The Second and Fourth Candle, should be white to have a further confirmation of the Pattern.


![Binance Review: How the Crypto Exchange Works [2024]](https://www.feedroll.com/wp-content/uploads/2024/03/binance-trading-100x100.png)


