The Ultimate Oscillator is an Oscillator that combines a short-term Moving Average, a medium-term Moving Average and a long-term Moving Average, to reduce the false signals.
General Features of the Ultimate Oscillator
– The Ultimate Oscillator is used to identify oversold/Overbought situations, Rise and Decline in prices, to confirm the Trend and to find divergences between prices and oscillator.
– Standard periods, are respectively 7/14/28 for the moving average of short, medium and long term. To increase the sensitivity of the oscillator and to obtain more signals, you have to lower the value of the periods (for example at 8/4/16, respectively for short, medium and long term Moving Average). Whereas to avoid false signals and have long-term signals, you have to increase the value of the periods (For example at 20/40/).
How to Interpret the Signals from the Ultimate Oscillator
– The Ultimate Oscillator rises, when there is an Uptrend; The Ultimate Oscillator is in decline, when there is a Downtrend.
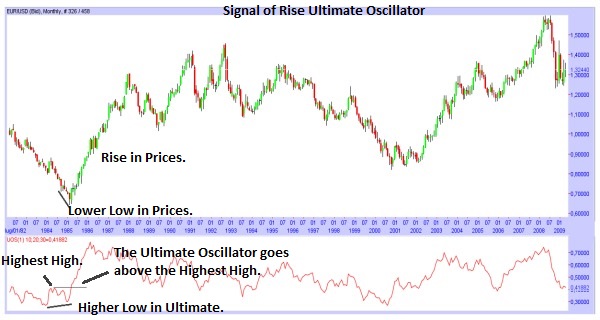
– Signal of rise from the Ultimate Oscillator: Firstly there is a Bullish Divergence between Prices and oscillator: there is a new Lower Low in the Prices while there is a new Higher Low in the Ultimate Oscillator (So in the Prices there is a decline, while in the Ultimate Oscillator there is a rise). Second point, the Lowest low in the Ultimate Oscillator that occurs during the Bullish Divergence should be below the value of 30 (so there is an oversold situation). Third point, the Oscillator goes above the “dotted line”, that starts from the Highest High that occurs during the Bullish Divergence: when the Ultimate Oscillator goes above the dotted line, this is the beginning of the rise in Prices.
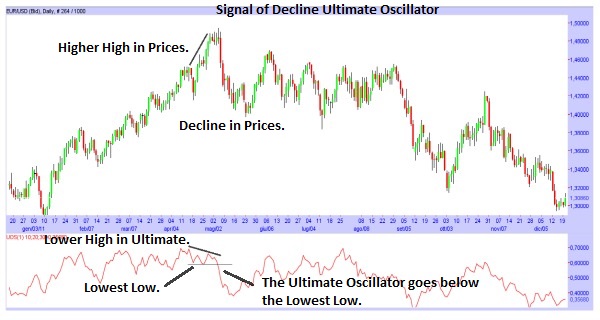
– Signal of decline from the Ultimate Oscillator: Firstly there is a Bearish Divergence between Prices and oscillator, there is a new Higher High in the Prices while there is a new Lower High in the Ultimate Oscillator (So in the Prices there is a rise, while in the Ultimate Oscillator there is a decline). Second point, the Highest High in the Ultimate Oscillator that occurs during the Bearish Divergence, should be above the value of 70 (so there is an overbought situation). Third point, the Oscillator goes below the dotted line, that starts from the Lowest Low that occurs during the Bearish Divergence: when the Ultimate Oscillator goes below the dotted line, this is the beginning of the decline in Prices.


![Binance Review: How the Crypto Exchange Works [2024]](https://www.feedroll.com/wp-content/uploads/2024/03/binance-trading-100x100.png)


