The Relative Strength Index, also known as RSI, is one of the most used and famous Oscillators; this Oscillator measures the speed and change of the price movements. As the other Oscillators, the shorter is the Period of the Oscillator, the more reactive will be but it will create more false signals.
General Features of the Relative Strength Index
– The Standard Period used for this Oscillator is 14 days; although it’s often used the Period of 9 days or 22 days.
– The value of the RSI oscillates between 0 and 100.
How to Interpret the Signals from the RSI
– Highs and Lows: when the RSI reaches the value of 70, it’s a signal of Overbought so there is a possibility of a reversal of the current Uptrend; whereas, when the RSI reaches the value of 30, it’s a signal of Oversold so there is a possibility of a reversal of the current Downtrend.
– Also in the RSI can be searched all the Patterns from the Technical Analysis and Supports and Resistances (The longer are the Patterns found, the more reliable are).
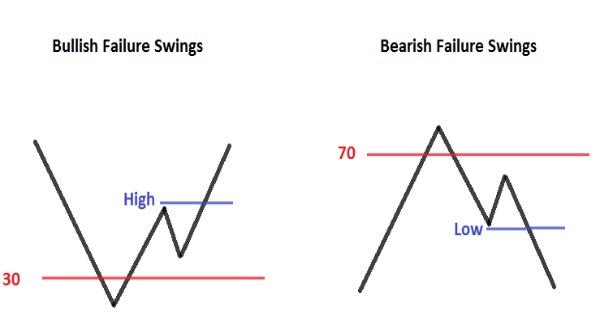
– Failure Swings: they focus only on the RSI for signals and ignore the movements of the Prices.
There is the Bullish Failure Swings, that is a signal of a possible Bullish Reversal: the RSI reaches a value below 30 (1) so there is a situation of Oversold, then rises above 30 (2) and falls again but this time does not reach the value of 30 and remains above it (3); then it rises again going above the Previous High (4).
There is the Bearish Failure Swings, that is a signal of a possible Bearish Reversal: the RSI reaches a value above 70 (1) so there is a situation of Overbought, then falls below 70 (2) and rises again but this time does not reach the value of 70 and remains below it (3); then it falls again going below the Previous Low (4).
– How to interpret the Divergences between RSI and Prices: Divergence means that on the Chart there is a certain movement, while the RSI does the opposite movement. There are two different types of Divergence.
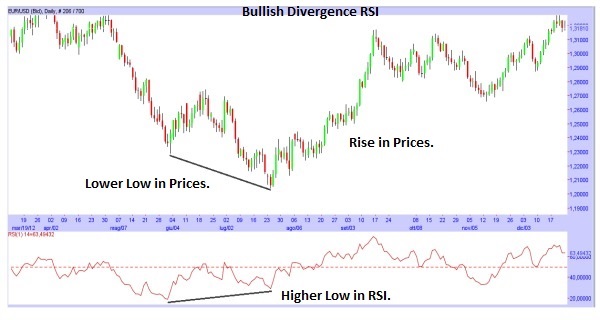
There is the Bullish Divergence, signal of a possible Rise: there is a new Lower Low in the Prices while there is a new Higher Low in the RSI (So in the Prices there is a decline, while in the RSI there is a rise); that is a signal of a possible Rise in Prices.
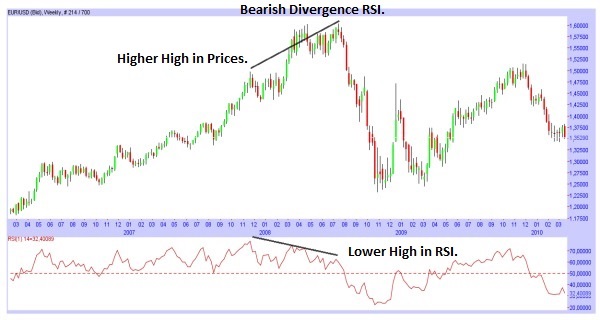
There is the Bearish Divergence, signal of a possible Decline: there is a new Higher High in the Prices while there is a new Lower High in the RSI (So in the Prices there is a rise, while in the RSI there is a decline); that is a signal of a possible Decline in Prices.
– Other Signals: when there are two Highs at the same levels in the Prices, but in the RSI there are two lower Highs, it means that there will be a decline in Prices; to have the confirmation, you should wait that RSI goes below the level of the Low that is between the two lower Highs.
When there are two Lows at the same levels in the Prices, but in the RSI there are two higher Lows, it means that there will be a rise in Prices; to have the confirmation, you should wait that RSI goes above the level of the High that is between the two higher Lows.




![Binance Review: How the Crypto Exchange Works [2024]](https://www.feedroll.com/wp-content/uploads/2024/03/binance-trading-100x100.png)


