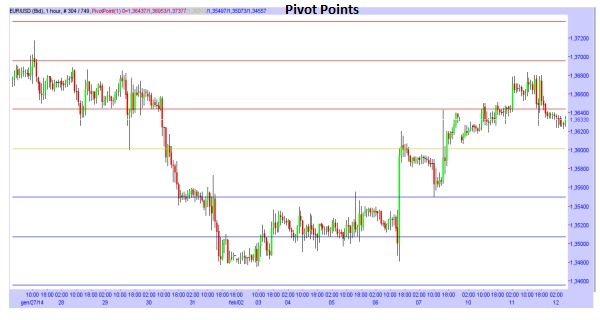
The Pivot Points are important levels of Support and Resistance for the future movements of the Prices; they are calculated with the average of the High, Low and Closing Price of the Previous Days. They can be used to predict the future movements of the Prices.
General Features of the Pivot Points
– There are three different types of Pivot Points: the Standard ones, the Fibonacci ones and the De Mark ones.
– Normally three level of Pivot Points are calculated, so there will be three Supports and three Resistances, that will divide the Chart in three different “Channels” in which the Prices will move. Moreover, there will be a Center Line between the Three Supports and Three Resistances.
How to Interpret the Signals from the Pivot Points
– If the Prices go above a line of the Pivot Points, it is a signal of the rise’s strength, and the Prices can reach also the next Line; once the Price reach the next Line and keep rising, it is possible that they will reach the next one. Whereas, if the Prices goes below a line of the Pivot Points, it is a signal of the decline’s strength, and the Prices can reach also the next Line; once the Price reach the next Line and keep falling, it is possible that they will reach the next one.
– The Pivot Points work as Supports and Resistances, so all the signals from the Supports and Resistances can be searched with the Pivot Points.


![Binance Review: How the Crypto Exchange Works [2024]](https://www.feedroll.com/wp-content/uploads/2024/03/binance-trading-100x100.png)


