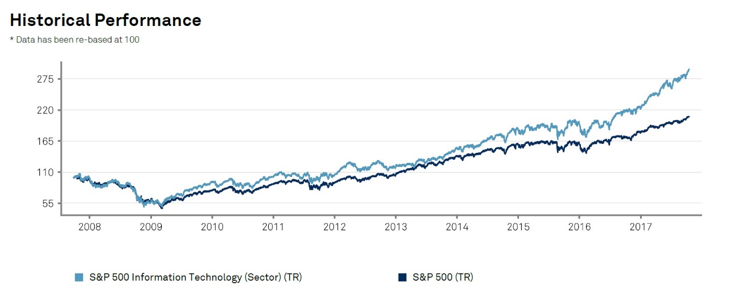
In the year 2000, the dotcom bubble burst and investors lost a fortune. However, in the nearly 2 decades since, value has returned to markets and tech stocks are no longer persona non-grata. In March 2000, the S&P 500 Information Technology Index reached 988.5, and it is currently at 1,050.95. This indicates that a massive and unprecedented recovery has taken place in the tech sector. The gains are evident across the board, and the 3-year annual returns are averaging 19.69% – remarkable by any stretch of the imagination.
For the layperson, such performances in the tech sector appear to defy logic and gravity. However, the S&P 500® Information Technology Index measures the performance of the top-ranking S&P 500 companies. Let’s consider the historical performance of the S&P 500 Information Technology Sector and the S&P 500 index since the global financial crisis of 2009. The close correlation between these two indices indicates that substantial growth has taken place, particularly since 2016. This is evident in the sharply appreciating values derived for investors in the financial markets.
For example, the annualized returns over 1 year are 28.88%, 3 years 17.36%, and 5 years 17.44%. In terms of price returns, the year to date recorded 26.02% returns on the S&P 500 Information Technology Index. But it wasn’t always a straight shot to profit central. Over the years, technology stocks were eroded away, losing as much as 80% of their value before prices started rising once again. The tech bubble of 2000 set the industry back many years, in much the same way as the housing crisis of 2007 rocked the financial markets for several years.
Should You Invest in FANG Stocks?
The big tech stocks include companies like Facebook, Amazon, Netflix and Google – the FANG stocks. While the bear market was underway, these stocks averaged well over 1,000% in returns. Now, when Apple is included in the mix, the total market capitalization of these 5 stocks exceeds the GDP of the UK.
According to Wilkins Finance expert Charles Mayweather Sr., there is growing concern about yet another tech bubble forming:
‘We must pay attention to the rising prices of tech stocks. Nothing defies gravity indefinitely, and when price corrections come into play, we could see a significant shakeup of the tech stock arena. Bear in mind that the valuations aren’t quite as inflated as we saw 17 years ago, but I would be careful not to write this off as simple analyst gobbledygook. If we look at FactSet as a case in point, the P/E ratios are trading at a significant premium over the past 10 years. Look for value when you buy tech stocks like Apple, Tesla, Alphabet, Twitter and the like. Ideas are valuable if they can be implemented. Everyone is buying into novel concepts hoping to make a fortune, but stay grounded in reality with an eye to the future if you want real value from tech stocks.’
The Recent Performance of Leading Tech Stock Companies
Apple (AAPL) – is currently trading at $159.35 per share, with a market capitalization of $823.23 billion and a price/earnings ratio of 18.09.
Facebook, Inc. (FB) – is currently trading at $175 per share with a market capitalization of $508.293 billion and a price/earnings ratio of 39.17.
Google (GOOG) – is currently trading at $990.80 per share, with a market capitalization of $691.19 billion and a price/earnings ratio of 35.91.
Amazon (AMZN) – is currently trading at $1,007.83 per share with a market capitalization of $484.2 billion and a price/earnings ratio of 256.35
What’s important to understand about the current stock prices (late October 2017) is the price/earnings ratios. The higher the P/E ratio, the more overpriced the stock. It is calculated as the stock’s current share price divided by its earnings per share (EPS) over 12 months. Clearly, inflated valuations are the order of the day.


![Binance Review: How the Crypto Exchange Works [2024]](https://www.feedroll.com/wp-content/uploads/2024/03/binance-trading-100x100.png)


