Let’s analyse the Head and Shoulders Top, another Pattern of the Technical Analysis. The Head and Shoulders Top is a very reliable Reversal Pattern. Let’s analyse it point by point. Remember, that in order to understand better the Patterns of the technical analysis, you should know how Trend Lines and Resistances/Supports work (For this reason we suggest you to read: What is a Trend and what are Trend Lines; Resistance and Supports).
Features of Head and Shoulders Top
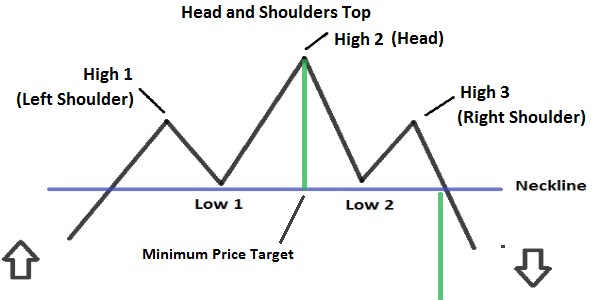
– Pattern composed by: a Left Shoulder, the Head, a Right Shoulder.
– When it occurs: The Pattern occurs during an Uptrend.
– Left shoulder: During a rise, there is an High (1) followed by a decline . The Low (1) that there is during the decline, usually remains above the Trend Line.
– Head: From the Previous Low (1), there is a rise in which there is an High (2) higher than the High (1) of the left shoulder. Then there is a decline, whose Low (2) can also break the Trendline.
– Right shoulder: From the Previous Low (2), there is a rise in which there is an High (3) lower than the High (2) of the head and that is located at the same level (More or less) of the High (1) of the left shoulder. From this point, there is a decline, that should breaks below (Goes from above to below) the neck Line.
– Neck line: Formed by connecting with a straight line the Low (1) and the Low (2). The slope of the neck line represents the strength of the future decline: If this line tends downwards, the strength will be greater. Whereas if this line tends upward, the strength will be lower.
– Volumes of trades: They can be measured with an indicator (On Volume Balance or the Chaikin Money Flow), or simply by analysing the volume levels. Volume levels are high during the rise that leads to the formation of the High (1) of the left shoulder and should be higher than the Volumes that there are during the rise that leads to the formation of the Head. After the formation of the Head the Volumes should decrease whereas the volumes should increase during the decline after the Right Shoulder and the breaking of the Neck Line.
– Break of the Neck Line: The Pattern is complete once the Prices break below (Go from above to below) the Neck Line. The line of the neck just cutted becomes a Resistance (While before was a Support). There can be a Pullback after the breaking of the neck line (There is a Pullback when the Prices return to the line that they have just cutted, then bounce on the line and come back to continue in their initial direction).
– Minimum Price Target: you have to measure the distance from the neck line to the High (2) of the head, then you will have to project it from the breaking point of the neck line to have the minimum Target Price of the decline. You should use other factors, such as previous supports, Fibonacci Retracements, medium-long Moving Average, to calculate at best the Price Target.
– Failure: If the Head and Shoulders Top fails, so If prices do not break below the neck line, there can be a rise instead of a decline.

![Binance Review: How the Crypto Exchange Works [2024]](https://www.feedroll.com/wp-content/uploads/2024/03/binance-trading-100x100.png)
![Dukascopy Broker Reviews, Pros & Cons [2024]](https://www.feedroll.com/wp-content/uploads/2024/03/Dukascopy-europe-100x100.jpg)
![Plus500 Reviews: How it Works, Pros & Cons! [2024]](https://www.feedroll.com/wp-content/uploads/2024/03/plus500_-100x100.jpg)


