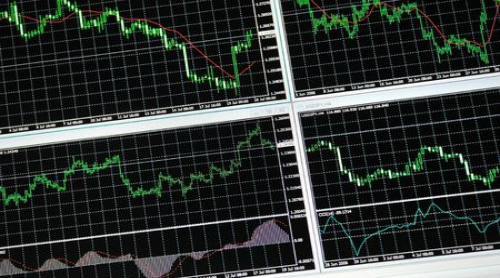
The technical analysis (As we said in our previous article: What do you need to work with Binary Options) is used to predict the direction of prices through the study of past market data, primarily price and volume of exchanges. The task of technical analysis is to study the movements of financial markets: these movements, according to technical analysis, are determined by the same investors and Traders. In Fact the study of technical analysis is also based on human psychology: the behaviour of humans in similar situations and over time, tends to repeat.
So the investors tend to repeat the behaviour of the investors that preceded them. For example, when you heard the news that the company X is about to go bankrupt, and you have the shares of that company X, what would you do? Simple: immediately you would sell your actions, aware of the risk of a substantial loss, if you will keep the actions of that company X. But not only you would sell the shares of that company: all the investors would sell the shares of this company X; the result? Due to the fact that all the investors are selling, the price will fall. Whereas if you have the shares of a Company Y, that has just launched a new product on the market that will be a success, what would you do? Simple: you will buy more shares of this company Y, aware that the value of the Company Y will rise because the profits of the Company Y will increase thanks to this new product. Same thing would do all the investors, and who will not have the shares of the Company Y, will start to buy. The Result? The price of the Company Y will start to rise.
As you have seen, the movements of the market are caused by the actions of the majority of Traders and investors: If on 100 Investors, 90 of them buy a certain share, the demand for this share will rise and the stock price will rise too. If on 100 Investors, 90 of them sell a certain share, the demand for this share will fall and the stock price will fall too . The movement (Rise or decline) of the price will be stronger depending on how many Traders are buying or selling a certain share: in fact, if on only 60 Traders on 100, are buying while the other 40 are selling, the price will rise, but not as much as the previous case where there were 90 traders on 100 that were buying.
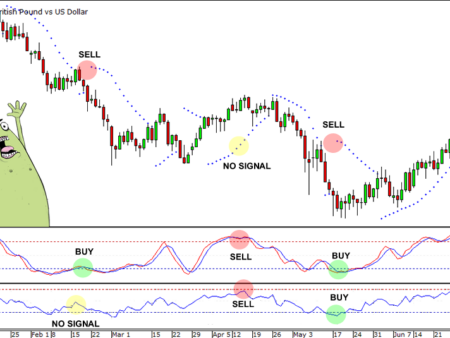
The movements of the Prices, as we have just seen, reflects the behaviour of the Investors. Because the behaviour of the investors repeats itself so often, if to a certain movement of the Prices it’s possible to connect a certain behaviour of the Investors (Sell or Buy), we will be able to use this movement in a profitable way. In fact, if we know that to X Movement of prices the behaviour connected is “buy”, we would do the same, using this X Movement in a profitable way.
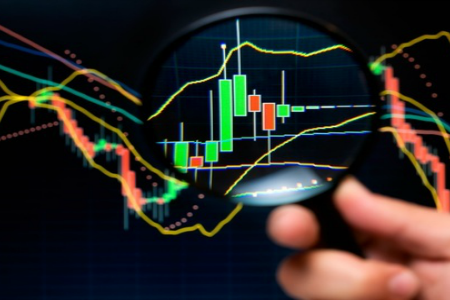
These particular movements of the Prices, are the Patterns of the technical analysis: it has been notified that when the prices moved in a particular way and through this movement formed a certain figure on the Chart (for example, a triangle or rectangle), the Investors had a certain behavior (Buy or sell). Therefore, studying these figures, it’s possible to predict the future decisions of Traders and therefore the future movements of the Prices. Graphic These Patterns of course are not foolproof: it can happen that a Pattern that is a sign of rise in Prices, will not lead to a rise in Prices and the prices remain at the same level or worse, start to fall. Why this? Because as we said previously, everything depends on how many Investors do simultaneously the same action: sell or buy. And it may happen that in sometimes, Investors behave in a different way because they follow a different reasoning than the one that you are following.
How you have understood, the fact of “being human”, has its positive side: the predictability factor and the repetition of the behaviours over the time; but also a downside: we reason and think differently, therefore we will take decisions not always all the same. However, in recent years the technical analysis is used more and more, and it means that more and more Investors are aware of These types of Patterns. This is an advantage, because more and more Traders will do exactly the same thing (for example) in case that occurs a certain Pattern on the Chart, increasing the chances that after this Pattern will happen precisely what you would expect (A rise or a fall in Prices).
Resources:
- Wikipedia – https://en.wikipedia.org/wiki/Technical_analysis – Technical Analysis
- E-investimenti.com – http://www.e-investimenti.com/analisi-tecnica/ – E-investimenti.com explain Technical Analysis – Italian Guide


![Binance Review: How the Crypto Exchange Works [2024]](https://www.feedroll.com/wp-content/uploads/2024/03/binance-trading-100x100.png)
![Dukascopy Broker Reviews, Pros & Cons [2024]](https://www.feedroll.com/wp-content/uploads/2024/03/Dukascopy-europe-100x100.jpg)
![Plus500 Reviews: How it Works, Pros & Cons! [2024]](https://www.feedroll.com/wp-content/uploads/2024/03/plus500_-100x100.jpg)


