The Stochastic Oscillator, often abbreviated to Stochastic, is one of the most important oscillators, that follows the speed of price movements; highlights the situations of overbought/oversold and gives signal of future reversal points and of rise and decline in Prices.
General Features of the Stochastic Oscillator
– Fast Stochastic: The initial calculation is based on the current value of the Prices and the Highs and Low values recorded in a certain period; This pair of lines form the fast stochastic, that is too reactive to be used in a profitable way.
– Slow stochastic: Calculating a moving average on the two previous lines, you will get a new pair of lines that are the slow stochastic; is less reactive and is easier to interpret.
– The value of the stochastic oscillator oscillates between 0 and 100, where 0 is the situation in which the closing price coincides with the Low of the period considered, whereas the 100 is the situation in which the closing price coincides with the High of the period considered.
– There is also the Full version of the Stochastic, which is totally customizable.
How to Interpret the Signals from the Stochastic Oscillator
– Values close to 100, mean overbought situation (There is the possibility of a decline in Prices); while values close to 0, mean an oversold situation (There is the possibility of a rise in Prices).
– Normally you should establish thresholds for overbought and oversold (80-20 or 70-30), below which you should ignore the signals to decrease the probability of run into false signals.
– The stochastic works better during sideways or weak Trend, which stages a well-defined and strong Trend.
– When the value of the Stochastic is below 20, it highlights an oversold situation from which can begin a Bullish Reversal of the current Trend. Whereas, when the value of the Stochastic is above 80, there is a situation of Overbought from which can begin a Bearish Reversal of the current Trend.
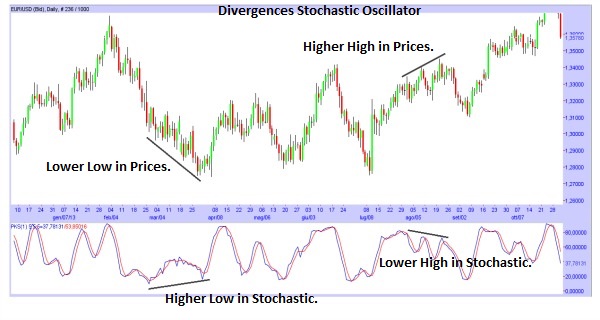
– How to interpret the Divergences between Stochastic and Prices: Divergence means that on the Chart there is a certain movement, while the Stochastic does the opposite movement. There are two different types of Divergence.
There is the Bullish Divergence, signal of a possible Rise: there is a new Lower Low in the Prices while there is a new Higher Low in the Stochastic (So in the Prices there is a decline, while in the Stochastic there is a rise); that is a signal of a possible Rise in the Prices.
There is the Bearish Divergence, signal of a possible Decline: there is a new Higher High in the Prices while there is a new Lower High in the Stochastic (So in the Prices there is a rise, while in the Stochastic there is a decline); that is a signal of a possible Decline in the Prices.
– 50 value line: it is very important, because it’s halfway between 0 and 100, so you have to be careful when the Stochastic goes above or below this line.
– Using “the set-ups”: A second type of Divergences that is possible between Prices and Stochastic.
There is the Bullish set-up, signal of a possible rise and is the opposite of a Bullish divergence: there is a new Lower High in Prices while there is a new Higher High in the Stochastic (So in the Prices there is a decline, while in the Stochastic a rise); Once you have recognized this signal on the chart, after the next Price decline, there should be a rise.
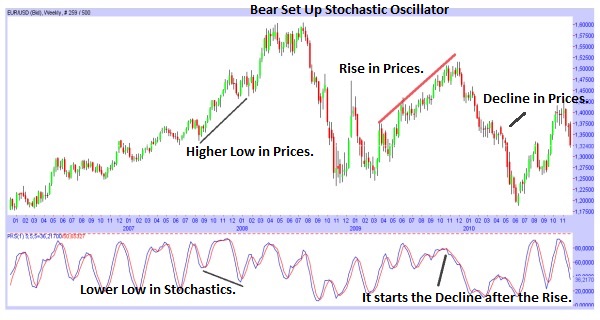
There is the Bearish set-up, signal of a possible fall and is the opposite of a Bearish Divergence: there is a new Higher Low in Prices, while there is a new Lower Low in Stochastic (So in the Prices there is a rise, while in the Stochastic there is decline); Once you have recognized this signal on the chart, after the next Price increase, there should be a decline.
– When prices are close to a Support while the stochastic is in oversold, if the Stochastic goes above the value of 20, it’s a signal of rise in Prices. Whereas, when prices are close to a Resistance while the stochastic is in overbought, if the Stochastic goes below the value of 80, it’s a signal of a possible decline in Prices.
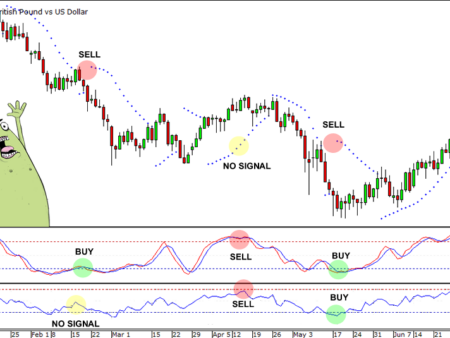
– Another signal is obtained when the K% line (The blue line) crosses the D% line (The red line); (are the names of the two lines that form the stochastic). When the K% goes above the D% is expected a rise in Prices; whereas, when the K% goes below the D% is expected a decline in prices.
![Binance Review: How the Crypto Exchange Works [2024]](https://www.feedroll.com/wp-content/uploads/2024/03/binance-trading-100x100.png)
![Dukascopy Broker Reviews, Pros & Cons [2024]](https://www.feedroll.com/wp-content/uploads/2024/03/Dukascopy-europe-100x100.jpg)
![Plus500 Reviews: How it Works, Pros & Cons! [2024]](https://www.feedroll.com/wp-content/uploads/2024/03/plus500_-100x100.jpg)


