The Ichimoku Indicator (Also called Ichimoku Kinko Hyo) is a Technical Analysis Method that is built on the Candlestick Chart, to improve the accuracy of forecast price movements; it’s used to search for Supports, Resistances and Trends. It’s composed by four parts that we will analyse one by one and we will explain how it works and all the operative signals that we can obtain from the Ichimoku. When you use the Ichimoku, you should analyse all the parts of the Ichimoku and not just one.
General Features and How to Interpret the Signals from the Ichimoku
The Ichimoku is composed by four parts:
1) Tenkan-Sen (Blue line on the chart):
– Also known as the Turning Line; it analyses a Period of 9 Previous Candles, that with a Daily TimeFrame (Of the Chart) correspond to a working week and a half in Japan.
– The Tenkan-Sen is the most responsive line of the Ichimoku, so it follows in a better way the changes in the Prices: it’s used as a Signal Line and as a Support or Resistance.
– Is an Indicator of the Trend: if the Tenkan-Sen is moving up or down, it means that there is a Trend in the Prices; if it moves horizontally, it means that there is a Sideways Trend.
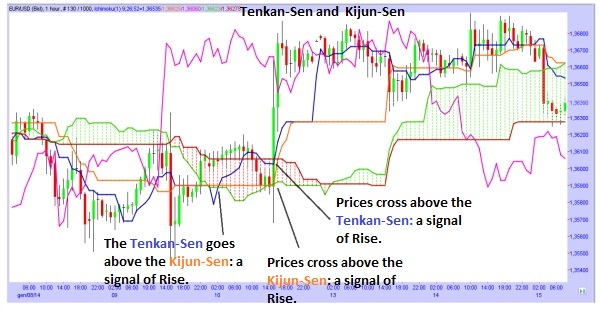
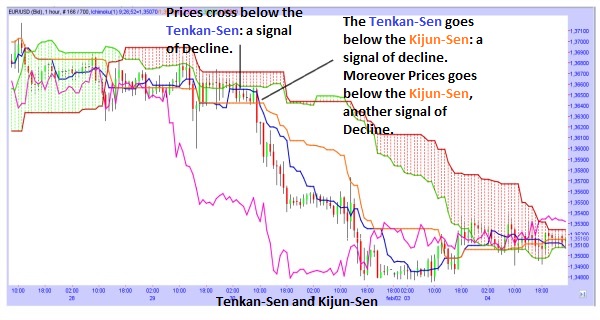
– When the Prices cross above (From below to above) the Tenkan-Sen, it’s a signal of rise in the Prices. Whereas when the Prices cross below (From above to below) the Tenkan-Sen, it’s a signal of decline in the Prices.
2) Kijun-Sen (Orange Line):
– Also known as Standard Line; it’s calculated as the Tenkan-Sen, but using a longer Period (In fact it analyses a Period of 26 Previous Candles, that correspond to a working month in Japan).
– The Kijun-Sen is not so responsive as the Tenkan-Sen and is less affected by the movements of the Prices; it’s used as Confirmation Line, or as Support/Resistance or Trailing Stop Line.
– It works as an Indicator of future price movements: if the Prices are above the Kijun-Sen, they could continue to go higher; while if the Prices are below the Kijun-Sen, they could continue to go lower.
– When the Tenkan-Sen breaks above (Goes from below to above) the Kijun-Sen, it’s a signal of a possible rise in the Prices; whereas, when the Tenkan-Sen breaks below (Goes from above to below) the Kijun-Sen, it’s a signal of a possible decline in the Prices.
– In both Tenkan-Sen and Kijun-Sen, there are some “Flat areas” (More in the Kijun-Sen). A Flat area means that for a certain number of Candles (The length of the Flat area) the Prices moved within a certain “Range” (It means that the High of the Period and the Low of the Period, are not changed). These Flat areas tend to “attract” the Prices: it means that the Prices tend to return near the Flat area. Whereas, in the Sloping areas of the Kijun-Sen and Tenkan-Sen, the Prices are below or above them (Especially in the Kijun-Sen).
– When the Prices break above (Go from below to above) the Kijun-Sen, it’s a signal of a possible rise in the Prices; whereas, when the Prices break below (Go from above to below) the Kijun-Sen, it’s a signal of a possible decline in the Prices.
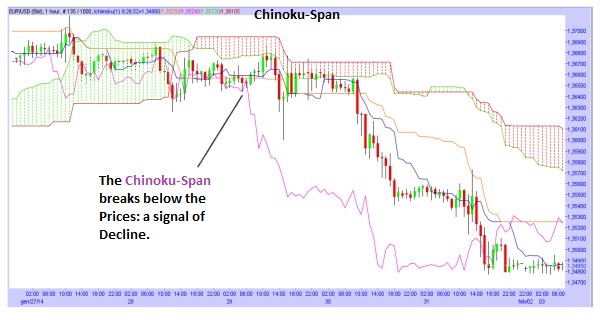
3) Chinoku-Span (Purple Line):
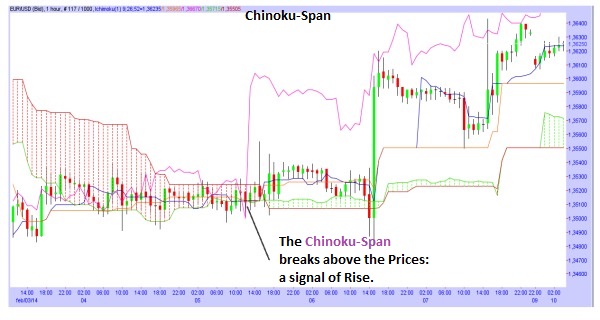
– Also known as Lagging Line; it’s calculated with the today’s closing Price projected back 26 days on the Chart; it’s used as Support and Resistance.
– If the Chinoku-Span breaks above (Goes from below to above) the Prices, it’s a signal of a possible rise in the Prices; whereas, if the Chinoku-Span breaks below (Goes from above to below) the Prices, it’s a signal of a possible decline in the Prices.
– The positive and negative peaks of the Chinoku-Span, can be used as Resistance or Support, depending on the position of the Prices from the Chinoku-Span.
– Normally, if the Chinoku-Span is above the Close of the Candles, it’s a signal of a possible Uptrend in Prices; whereas, if the Chinoku-Span is below the Close of the Candles, it’s a signal of a possible Downtrend in Prices.
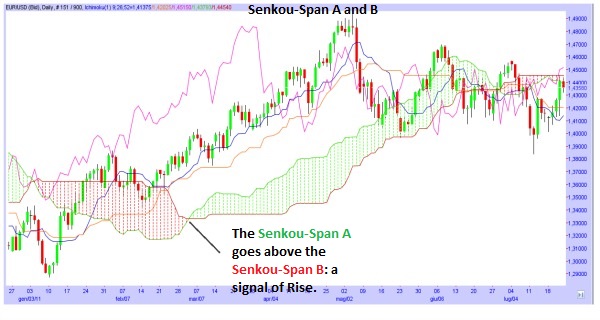
4) Kumo: Is an area composed by two Indicators (Represented on the Charts by two Lines), the Senkoun-Span A and the Senkou-Span B. These two Indicators, are projected forward of 26 Candles, so that also the Kumo will anticipate the movements of the Prices.
– The Senkou-Span A (Green Line): is calculated with the average of the values of the Tenkan-Sen and Kijun-Sen of the current Candle, then the average is projected forward of 26 Candles. If the Prices are above the Senkou-Span A, the Upper Senkou-Span will work as a First Support, while the Lower Senkou-Span will work as a Second Support.
Whereas, if the Prices are below the Senkou-Span A, the Upper Senkou-Span will work as a First Resistance, while the Lower Senkou-Span will work as a Second Resistance.
– The Senkou-Span B (Red Line): is calculated in the same way as the Senkou-Span A, but using a longer Period (52 Candles).
– Kumo: is the space or area, between the Senkou-Span A and Senkou-Span B.
– When the Senkou-Span A crosses the Senkou-Span B, it’s a signal of a possible reversal of the Trend. When the Senkou-Span A is above the Senkou-Span B, the Kumo is positive while when the Senkou-Span A is below the Senkou-Span B, the Kumo is negative.
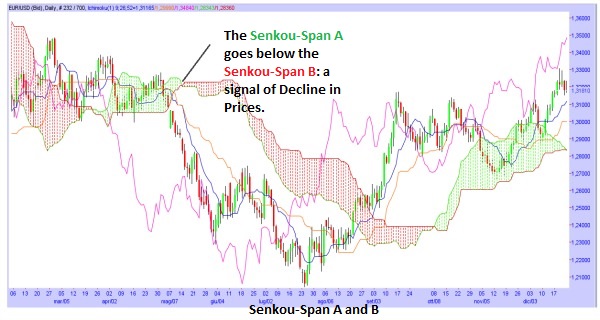
– When the Senkou-Span A breaks above (Goes from below to above) the Senkou-Span B, and the Kumo goes from Negative to Positive, it’s a signal of rise in the Prices; whereas when the Senkou-Span A breaks below (Goes from above to below) the Senkou-Span B, and the Kumo goes from Positive to Negative, it’s a signal of decline in the Prices.
– The Kumo changes in shape and height based on Price changes and it represents the volatility of the Prices; more the Kumo is wide, the higher the volatility will be.
– When the Prices are above the Kumo (Especially if it’s positive), there is an Uptrend; whereas when the Prices are below the Kumo (Especially if it’s negative), there is a Downtrend.
– The “Flat” areas of the Senkou-Span B attract the Prices.
– When the Prices are within the Kumo and then go out, it’s a signal of rise if they go out from the Kumo with a rise; whereas if they go out with a decline, it’s a signal of decline.
– The values of the Senkou-Span A and Senkou-Span B, can be used as Supports and Resistances; the more the Kumo is wide, the more reliable will be the Support or Resistance.
How to evaluate the Signals from the Ichimoku
For each signal that you obtain from the Ichimoku, you should verify if it is reliable or not with other Indicators or Pattern; you can also use one of the following methods:
– A First evaluation can be done watching the Kumo, specially the position of the cross (The cross between two lines of the Ichimoku) from the Kumo. If the cross is a signal of rise and it occurs above the Kumo, this signal will be more reliable; whereas, if it occurs inside the Kumo, it will not be so reliable; while if it occurs below the Kumo, its reliability is lower.
If the cross is a signal of decline and it occurs below the Kumo, this signal will be more reliable; whereas, if it occurs inside the Kumo, it will not be so reliable; while if it occurs above the Kumo, its reliability is lower.
– A Second evaluation can be done observing the Kumo of the next Days. For example, if we have a signal of rise, we can observe the Kumo of the future movements of the Prices to search for a confirmation of the signal; in this case the signal can be confirmed if the Kumo is positive and is wider, or if the Kumo is negative but tends to contract (Whereas in case of a signal of decline, it can be confirmed if the Kumo is negative and wider, or if the Kumo is positive but tends to contract).
– A Third evaluation can be done from the Slope of the Kijun-Sen: if the Kijun-Sen is flat, it attracts the Prices and if we have a signal during this situation, the signal will be less reliable. Whereas, if we have a signal when the Kijun-Sen is sloping, the signal will be more reliable. The same considerations can be done with the Senkou-Span B, that works in the same way of the Kijun-Sen.
![Binance Review: How the Crypto Exchange Works [2024]](https://www.feedroll.com/wp-content/uploads/2024/03/binance-trading-100x100.png)
![Dukascopy Broker Reviews, Pros & Cons [2024]](https://www.feedroll.com/wp-content/uploads/2024/03/Dukascopy-europe-100x100.jpg)
![Plus500 Reviews: How it Works, Pros & Cons! [2024]](https://www.feedroll.com/wp-content/uploads/2024/03/plus500_-100x100.jpg)


