Have you ever wondered when working on forex trades what is going on within the market? Indicators can help you see just what’s happening as they will let you know about how values will change.
Indicators are designed to work for a reason. They will help you identify changes in forex values and alert you to the potential for certain values to decline.
Indicators let you know about the changes that can take place and what can cause values to go up and down after a while. This will help you figure out what might be happening with your investments.
This chapter will help you understand what goes into the many indicators that can be found on the forex market. You might be surprised at how effective some of these indicators can really be.
Leading and Lagging
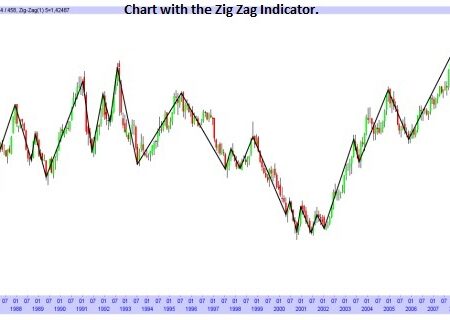
First, let’s talk about leading and lagging indicators. These are used to help identify trends:
- A leading indicator shows signals where new trends or reversals begin.
- Lagging indicators focus on when trends start.
In other words:
- Leading indicators show what happens before the trend or reversal occurs.
- Lagging indicators have signals that appear after those trends start.
Think of these indicators as overall signs that something is happening with a pair.
The lagging indicator will show you a trend after a price changes and you see that the value is going up or down. Needless to say, you might be too late in terms of trying to get into a particular position when this is put into consideration.
A leading indicator can help you see what trends are going about and how something might move in the future. This is not to say that it will be correct every single time but it’s worth checking out.
You must be cautious when reviewing these particular indicators to ensure you have the right sense of support for when you are trying to invest in a particular pair of value to you. Oscillators can especially help you out; this will be discussed in a few bits.
Pivot Points
Pivot points are used to determine where the value of a currency pair will go in the future. This works with a simple setup:
- The high, low and close are added together.
- They are then divided by 3.
- This will give you the pivot point to see where the value will go.
There are a few extra points to see:
- The first resistance point will be double the point you created minus the low. This helps you see where the value of the transaction will head out to.
- The first support is double the point minus the high. It shows you the total value that the pair could get into.
- The second resistance is the point plus the (high minus low).
- The second support is the point minus the (high minus low).
You don’t have to worry about doing math on your own to figure out the pivot points. A trading program that a broker can provide you with can help you calculate your pivot points.
These can be used to figure out the resistance and support within your pairs of interest. This can help you figure out trends to give you an easier time with making a proper decision over what you might be interested in going after. These may also be used with candlesticks to measure the overall sentiment of the market.
Momentum Indicators
Momentum indicators are often used to illustrate when the value of a pair mixes in with the moving average. In particular, these indicators are often used to confirm trends based on what can and cannot change after a while. These will help you identify what might occur within a pair.
If the value goes over the moving average within a period of time then it might be a sign that the trend is moving up and it’s time to buy. Meanwhile, you might have to sell if the moving average starts to climb above the actual value. You can always use a trading platform to get confirmation on the values of whatever you are using. This in turn will help you confirm whatever you are trying to invest in.
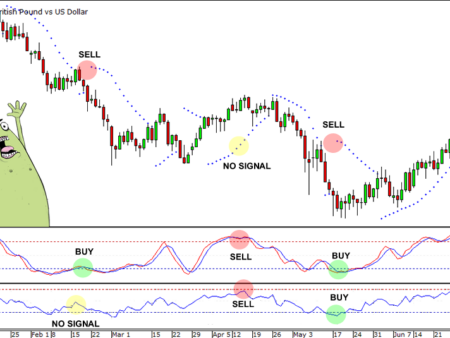
Oscillators
Oscillators will help you identify how the value of a pair might move between two particular points. This helps you see what range a pair might come with.
An oscillator can appear at the point between when the value of something stops going up or down and when it starts to change. A computer program can always help you to calculate what is going on within your currency pair of interest.
A great point about oscillators is that they can be rather consistent around currency pairs. You might find ones that will be consistent in terms of how the values of different pairs might change and adjust themselves over time. This in turn should give you more control over whatever you are trying to invest in.
These indicators are important to review and should help you understand what you’re going to get out of a currency pair. When used right, you will see if something is stable or if you need to look for something a little different in terms of what’s available.
![Binance Review: How the Crypto Exchange Works [2024]](https://www.feedroll.com/wp-content/uploads/2024/03/binance-trading-100x100.png)
![Dukascopy Broker Reviews, Pros & Cons [2024]](https://www.feedroll.com/wp-content/uploads/2024/03/Dukascopy-europe-100x100.jpg)
![Plus500 Reviews: How it Works, Pros & Cons! [2024]](https://www.feedroll.com/wp-content/uploads/2024/03/plus500_-100x100.jpg)


