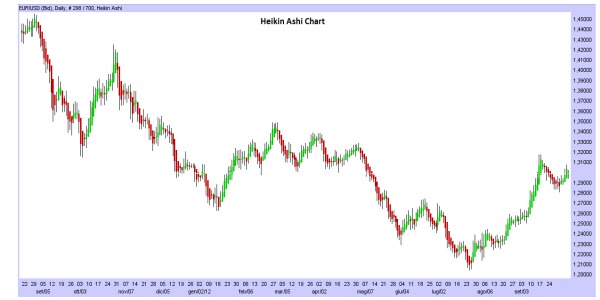
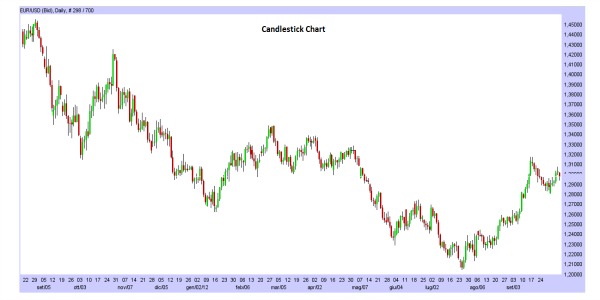
The Heikin Ashi chart is a variant of the normal Candlestick Chart: is composed by bars that are similar to Candles. Each bar is called “Candle Line” or just Candle. The most important feature of this chart is that can filter out some “noise” in the movements of the Prices, to better understand the current Trend. The “noise” are all the oscillations of the Prices that can cause false signals or can lead to a misunderstanding of the current Trend. In fact with the Heikin Ashi it’s easier to follow a Trend than with the Candlestick Chart.
We suggest you to read the article related to the Candlestick Chart, to better understand this article related to the Heikin Ashi Chart: Japanese Candlestick Chart .
The Heikin Ashi Chart
As you can see from the previous image, with the Heikin Ashi is easier to follow a Trend. This is its main feature, thanks to the particular way in which is created:
– The Close of a Candle of the Heikin Ashi is created in this way: Close = (Open + High + Low + Close) / 4 .
– The Open of a Candle of the Heikin Ashi is created in this way: Open = (Open of the Previous Candle + Close of the Previous Candle) / 2 .
– The High of a Candle of the Heikin Ashi is created in this way: High = Is the maximum value among the High, Open and Close of the Candle.
– The Low of a Candle of the Heikin Ashi is created in this way: Low = Is the minimum value among the Low, Open and Close of the Candle.
Of course (As on the Candlestick Charts) it’s possible to search on the Heikin Ashi Chart all the Candlestick Patterns, all the Patterns from the Technical Analysis and is possible to apply all the Indicators/Oscillators that you want.
How to interpret an Heikin Ashi Chart
Let’s see now how an Heikin Ashi Charts should be interpreted, to understand the Trend Prices are:
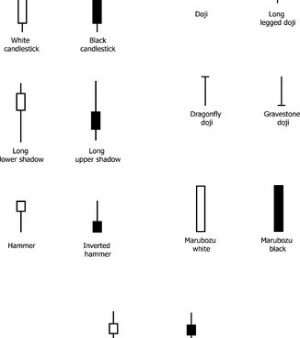
– Length of the Real Body of the Candles: Through the Length of the Candles, we know the “strength” of a Trend; in fact, when the Real Body is very long, the Trend is stronger than the normal. Whereas, when the Real Body is very short, the Trend is weaker than the normal.
– Recognize a strong Uptrend: In this case, the Candles are long and white, and they have only the Upper Shadows, that are very long (If they have also the Lower Shadows, they are very short). If during an Uptrend on a Heikin Ashi Chart, the Candles start to “show” also long Lower Shadows, that means that the current Uptrend is weakened; another signal of weakness of the current Uptrend, are the Real Bodies of the Candles: instead of become longer, they start to become shorter.
– Recognize a strong Downtrend: In this case, the Candles are long and black, and they have only the Lower Shadows, that are very long (If they have also the Upper Shadows, they are very short). If during a Downtrend on a Heikin Ashi Chart, the Candles start to “show” also long Upper Shadows, that means that the current Downtrend is weakened; another signal of weakness of the current Downtrend, are the Real Bodies of the Candles: instead of become longer, they start to become shorter.
– Indecision of the Markets: When there are short Candles, with Upper and Lower Shadows (Also with very long Upper/Lower Shadows), they mean “indecision”; indecision that can lead to a reversal of the Trend sometimes.
Some signals from the Heikin Ashi
– Doji Candles and Spinning tops, show a phase of indecision of the markets, that can lead to a future reversal of the current Trend (Reversal, that can be confirmed from the Candles that follow the Doji and Spinning Tops).
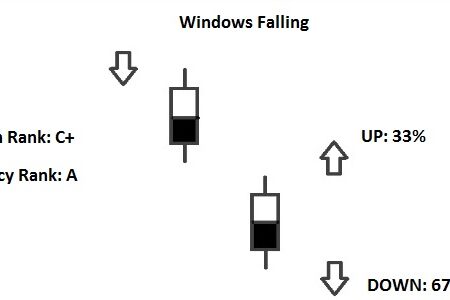
– A signal of a Rise in prices occurs when there are Three black Candles followed by Two white Candles: the next Candle (Or Candles) should be a white one. While a signal of a Decline in prices occurs when there are Three white Candles followed by Two black Candles: the next Candle (Or Candles) should be a black one. Of course, this do not always happen: for this reason it should be better to analyse the Heikin Ashi with other “tools”, as the Candlestick Patterns, the Patterns from the Technical Analysis and the Oscillators/Indicators.
![Binance Review: How the Crypto Exchange Works [2024]](https://www.feedroll.com/wp-content/uploads/2024/03/binance-trading-100x100.png)
![Dukascopy Broker Reviews, Pros & Cons [2024]](https://www.feedroll.com/wp-content/uploads/2024/03/Dukascopy-europe-100x100.jpg)
![Plus500 Reviews: How it Works, Pros & Cons! [2024]](https://www.feedroll.com/wp-content/uploads/2024/03/plus500_-100x100.jpg)


