
The fact that the binary options are a financial instrument so easy to use and to understand, leads many people to believe that being able to earn with this financial instrument is simple as the financial instrument itself. That is not true. So, what do you need to work with binary options? To earn with binary options, it is essential to know how to predict future price trends.
This means that each “aspiring” Trader, has not only to stay informed about the financial markets every day, but has also to learn the basic knowledge of Trading and the related studies, to be able to contain the risk of a wrong prediction and optimize the success of its predictions.
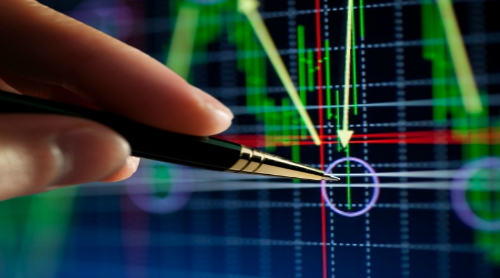
Interpreting the Charts
With binary options, as well as other financial instruments such as Stocks, Equities or Forex market, it is fundamental to be able to read and interpret the charts. Thanks to the Charts, we can see the current price trend but more important thing, we can study the past trend of prices and predict the future movements of the Prices. Knowing how to interpret a chart correctly, is something that you don not learn in a day and it takes a lot of practice, but it’s nothing of impossible. Moreover, you should be able to interpret more than one chart type: the “standard” chart (That is the most known), is the Line Chart. To get more information from the charts, however, you should use the Japanese candlestick Chart (Candlestick Chart) and also the Heikin Ashi Chart. There are also other types of charts (For example the HLC Bar or Bar chart), but the concept remains the same: the more charts you know how to interpret, the better is.
Technical Analysis
Technical analysis is the study of the evolution of prices in financial markets over time, so you can predict on the basis of the data collected, the future trend of prices. The technical analysis is used to predict the direction of prices through the study of past market data, primarily price and volume of exchanges. The task of technical analysis is to study the movements of financial markets: these movements, according to technical analysis, are determined by the same investors and Traders. In Fact the study of technical analysis is also based on human psychology. An important part of the Technical Analysis to study, is the part about the Patterns (That are certain movements of the Prices, that they repeat over the time): studying the Patterns of the Technical Analysis, can help the Traders to recognize these Patterns and be able to predict the future movements of the Prices (Because for each Pattern is associated a rise or decline in Prices).
Indicators and Oscillators
Oscillators and Indicators are “tools” of the Technical Analysis, used to study the movements of the Prices. There are a lot of Oscillators and Indicators, one different from the other, but all useful. Normally they are applied on the same chart of the Prices or in a smaller chart that is located below the Chart of the Prices, so you can compare the price movements and the movements of the oscillator. Through this comparison, depending on which Oscillator you are use, you will get a “signal”(for example a signal of rise in Prices or decline in Prices). They can be used also to confirm the Patterns of the Technical Analysis or the Candlestick Patterns, and to confirm or not a Trend or Reversal.
Candlestick Patterns
As mentioned previously, the Candlestick Chart is a special type of chart; Japanese Candlestick are quite characteristics, and thanks to them you will obtain more information than the information that you would obtain from a Line Chart. Moreover, it is very important the study of the Candlestick Patterns; Patterns from which we can obtain signals of rise or decline in Prices, that can help us in predicting the future movements of the Prices.
Fundamental Analysis
The Fundamental analysis attempts to determine the “correct” price of an Asset: for example, to determine the correct price of a share of a stock, you should study the financial statements of the company, its management and competitors, its market, its debts and earnings, etc… . Moreover, you should study the overall state of the economy of the business in which is the Company involved, and paying attention to all the news related to the Company or the Market in which works the Company. If you know the “correct” price for the share of a Company, you are able to recognize when the share is overrated or underrated (So you will know if it is the moment to buy or sell these shares). For the Binary Options, the Fundamental Analysis is not so important, because the term of trading is very short; but you should pay attention to the daily news related to the Asset that you are trading, because they can influence the movements of the Prices for the short-term.
Stay Up To Date
As we have just said, it’s very important to pay attention to the daily news related to the Asset that you are trading, because they can influence the movements of the Prices for the Short-term. In fact for example, the news of the launch of a new product from a Company can lead to a rise in Prices (Of the shares), because it’s expected that this product will be a success (Probably as the previous ones) and so the earnings of the Company will rise; whereas, bad news can lead to a decline in Prices . Of course the news must be important enough to cause significant movements in Prices.
Conclusions
More information about for example, the Technical Analysis, the Candlestick Patterns, the Indicators and Oscillator, the Interpretation of the charts, etc… can be found on our website, in which we try to explain in a clear and detailed way every single aspect of them.
![Binance Review: How the Crypto Exchange Works [2024]](https://www.feedroll.com/wp-content/uploads/2024/03/binance-trading-100x100.png)
![Dukascopy Broker Reviews, Pros & Cons [2024]](https://www.feedroll.com/wp-content/uploads/2024/03/Dukascopy-europe-100x100.jpg)
![Plus500 Reviews: How it Works, Pros & Cons! [2024]](https://www.feedroll.com/wp-content/uploads/2024/03/plus500_-100x100.jpg)


